


8 Embedded Analytics Tools That Support Natural Language Queries in 2026

Alim Goulamhoussen
Publié le 26.02.26
Mis à jour le 23.04.26
10 min
The short answer:
The embedded analytics platforms that genuinely support natural language queries for end users in 2026 are Toucan, ThoughtSpot Embedded, Sisense (Simply Ask), GoodData AI Assistant, and Qrvey. Looker Conversational Analytics reached GA in April 2026. Each takes a different technical approach. The critical variable is not whether a platform offers NLQ, but whether it grounds responses in a semantic layer. Without that, NLQ produces wrong answers that look correct.
The global embedded analytics market was valued at $23.41 billion in 2025 and is projected to reach $100.98 billion by 2035, according to Precedence Research. NLQ is one of the primary drivers of that growth, because it's the feature that turns passive dashboards into tools people actually want to use.
What is natural language query (NLQ) in embedded analytics?
Natural language query (NLQ) in embedded analytics is the ability for end users to type a question in plain English inside a SaaS product and receive a chart, metric, or data answer without writing SQL or configuring a dashboard. The NLQ layer sits between the user's question and the underlying data, interpreting intent and generating the correct query automatically.
The critical distinction is between grounded and ungrounded NLQ. Grounded NLQ anchors the language model's responses to a validated semantic layer, where "churn rate" means your definition, pulling from your columns, within each customer's data scope. Ungrounded NLQ lets the model interpret freely, which produces plausible-looking but unreliable results. In a customer-facing deployment, that difference is between a feature your users trust and one that erodes it.
Why NLQ requirements differ between standalone BI and embedded products
In a standalone tool like Tableau or Looker, the person asking the question is usually a data analyst who understands the underlying data model. They can tolerate ambiguity, iterate on a query, and debug when something looks off.
In an embedded product, your end users are your customers. They're a finance director using your SaaS platform to track KPIs, or a logistics manager checking fleet performance. They don't know your data schema. They don't want to iterate. They expect the same experience they get from asking Google a question.
That shift in expectation is why NLQ in embedded analytics requires more than a language model sitting on top of your data. It requires:
-
A semantic layer that maps business terms to the correct tables, fields, and metrics
-
Row-level security so users only see data they're permitted to see
-
Tenant isolation in multi-customer deployments
-
Grounded outputs anchored to your actual data, not hallucinated
-
A UI that feels native to your product, not like a third-party widget
Without those components, NLQ becomes a liability. A user asks a reasonable question, gets a wrong number, and loses trust in the entire analytics layer.
How NLQ works under the hood
A user types a question in plain English. The platform parses it using natural language processing to identify intent, entities, and filters. That intent gets translated into a structured query, usually SQL or a semantic layer expression, which runs against the connected data source. The result returns as a chart, table, or narrative summary.
The quality of that translation is where platforms diverge sharply. Some rely on a generic LLM with minimal grounding, which produces plausible-looking but unreliable results. Others build a purpose-built semantic layer that constrains the LLM to known, validated metrics and dimensions. The latter is significantly more accurate in production, and far more appropriate when customers are making real business decisions from the output.
A well-grounded NLQ system also handles follow-up questions conversationally. "Now break that down by sales rep" after "show me Q1 revenue" should maintain context and refine the query, not start from scratch.
Which platforms support NLQ in embedded deployments in 2026
Not every platform that claims NLQ support delivers it in an embedded, customer-facing context. Here's a direct comparison of the main options.
Toucan: semantic-layer NLQ built specifically for ISVs
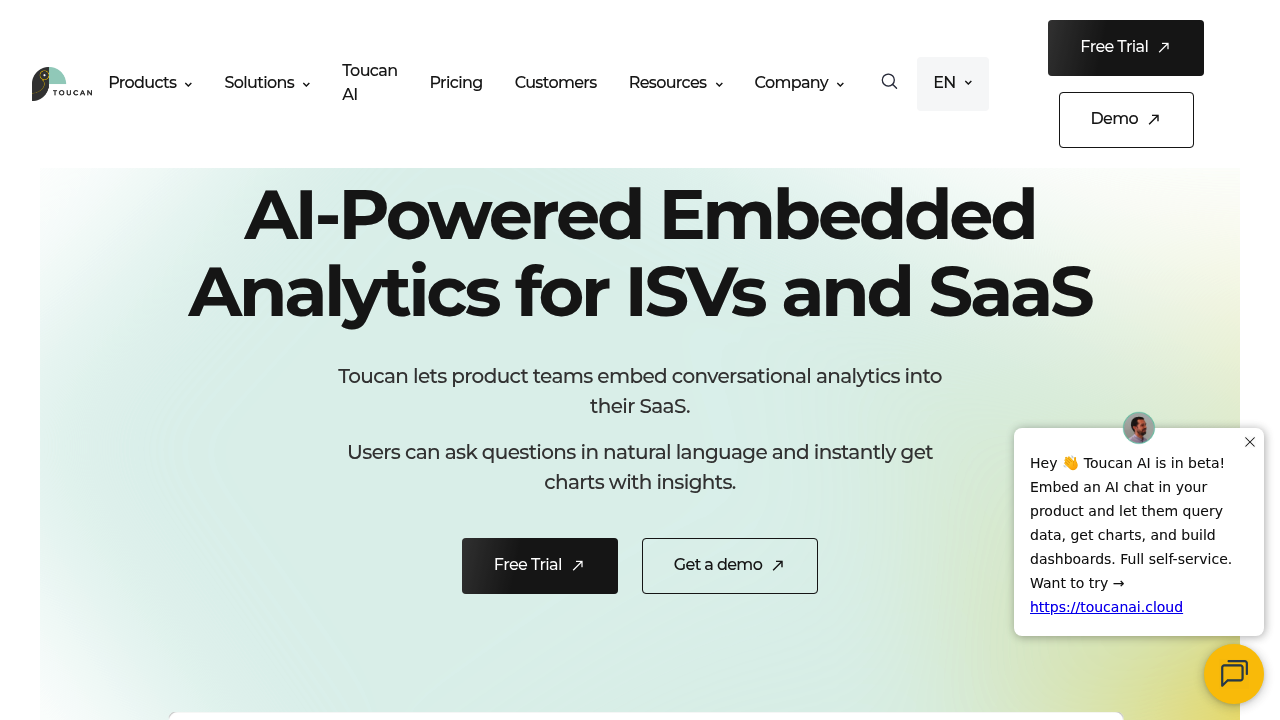
Toucan is the embedded analytics platform built specifically for ISVs and SaaS companies shipping analytics to external customers. Its conversational analytics layer is grounded in a semantic model the product team defines: your metrics, your terminology, your business logic. Users ask questions in plain language and receive charts and narrative context that reflects how the business actually works.
The semantic layer for embedded AI analytics is the core architectural choice that separates Toucan from generic LLM-based approaches. It constrains what the AI can answer, eliminating the hallucination risk that surfaces in ungrounded systems. Governance and row-level security are built in, so NLQ can be deployed to customers without risk of data leakage across tenants.
For SaaS companies and ISVs, Toucan is designed specifically for customer-facing embedded analytics, not internal BI. The no-code setup means product teams can iterate on the analytics layer without engineering cycles. According to Toucan's data, conversational analytics adoption rates reach 60-70% among non-technical users, compared to 30-40% for traditional pre-built dashboards. Embedding typically takes hours rather than months.
Toucan holds a 4.7/5 rating across 163 verified G2 reviews. Users consistently note how quickly non-technical end users get value without any training.
NLQ approach: Semantic layer-grounded conversational AI, hallucinations prevented by design
Best for: SaaS companies and ISVs who need to ship NLQ to end users quickly with strong governance and a fully branded experience
Integration: React, Angular, Vue SDKs; REST APIs; go-live in 2-4 weeks
ThoughtSpot Embedded: search-first analytics for enterprise
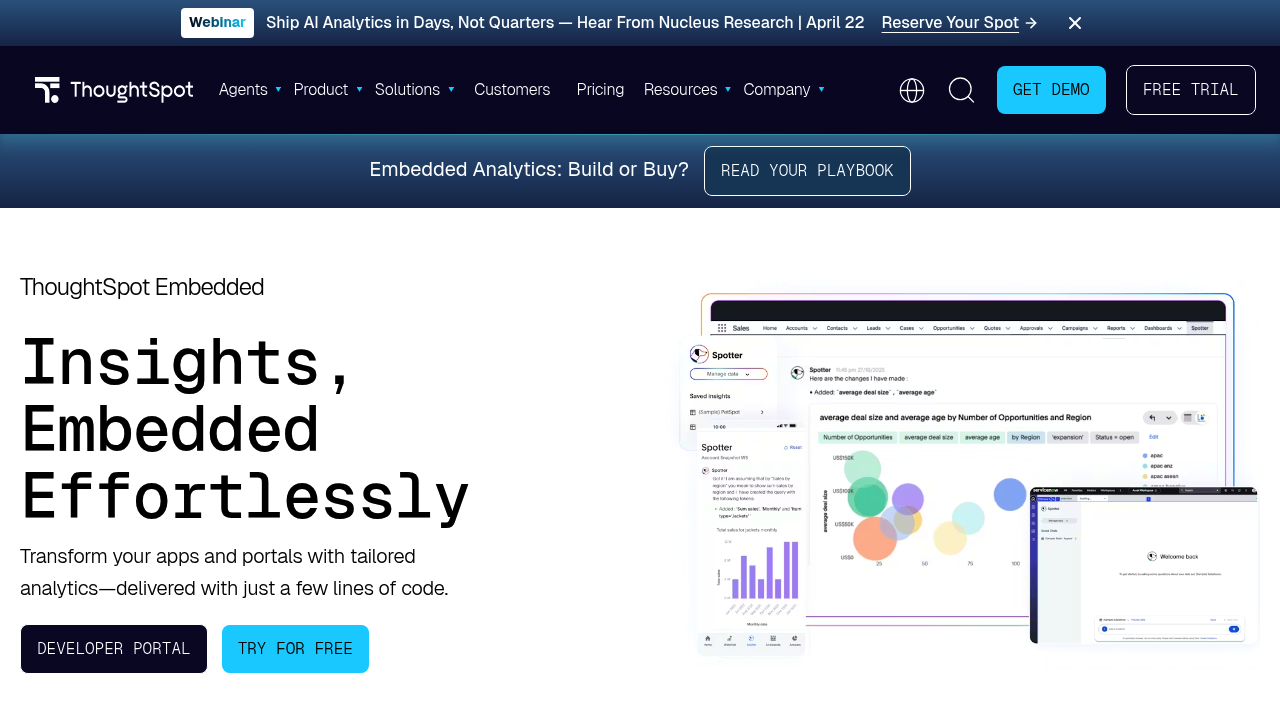
ThoughtSpot built its entire product around search-driven analytics, so NLQ is the core interaction model rather than an afterthought. Its Spotter AI engine uses GPT-based processing grounded in ThoughtSpot's semantic layer (TML) to interpret questions and generate answers. In December 2025, ThoughtSpot launched four dedicated BI agents (SpotterViz, SpotterModel, SpotterCode, SpotterGovern) that extend NLQ into dashboard building and semantic modeling via natural language prompts.
ThoughtSpot was named a Leader in the 2025 Gartner Magic Quadrant for Analytics and BI Platforms. The Visual Embed SDK and REST APIs make it embeddable in most tech stacks. The trade-off is cost: ThoughtSpot is priced for enterprise budgets and carries meaningful per-seat fees, which can make customer-facing embedding expensive at scale.
NLQ approach: Spotter AI agent with search-driven analytics and agentic BI capabilities
Best for: Enterprise SaaS products where NLQ depth and accuracy are non-negotiable and budget is available
Integration: Visual Embed SDK, REST APIs, live cloud warehouse connectivity
Sisense: Simply Ask NLQ with developer-first embedding
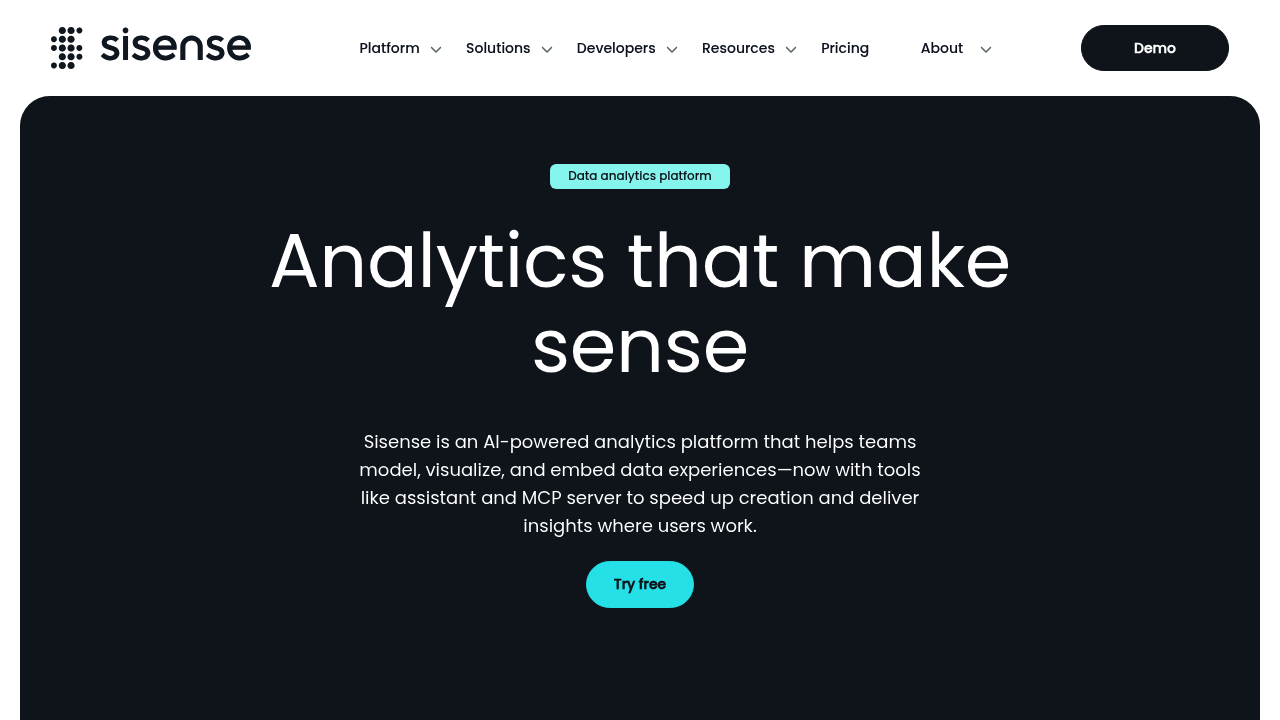
Sisense has offered NLQ since 2020 through its Simply Ask feature. The 2025.4 release (October 2025) refined the NLQ engine for better precision on complex business questions. The Sisense Assistant, now in beta, adds a broader AI-first interface for building, exploring, and embedding analytics, combining NLQ with chart suggestions and creation assistance.
Sisense positions itself as developer-first through its Compose SDK, which gives engineering teams component-level control over the embedded experience. The depth of semantic grounding varies by configuration, which puts more responsibility on the product team's implementation choices.
NLQ approach: Simply Ask (NLQ engine) + Sisense Assistant AI interface
Best for: Mid-market SaaS products with solid developer resources needing embedded NLQ
Integration: JavaScript SDK, REST APIs, iFrame and component-level embedding
Looker: Conversational Analytics now GA in embedded environments
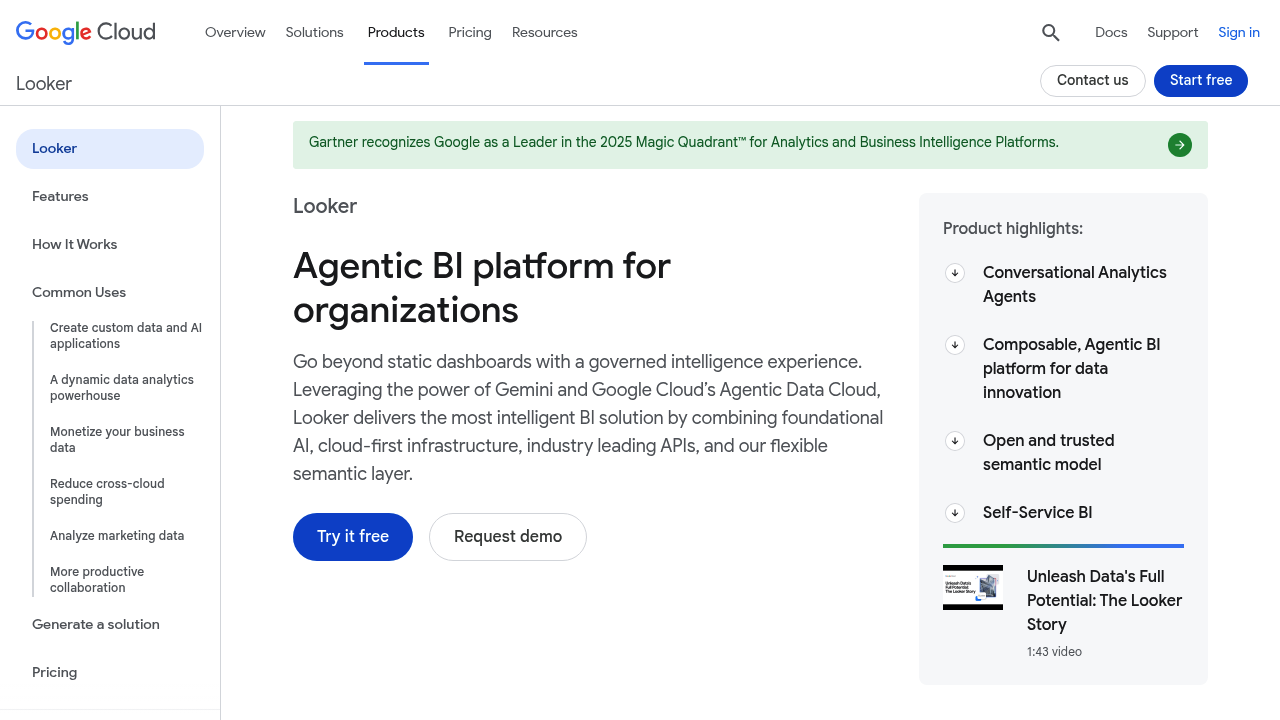
As of April 2026, Google Cloud made Looker's Conversational Analytics generally available in embedded environments. Developers can embed the full natural language chat experience via iframes or SDK. Looker's NLQ is powered by Gemini for Google Cloud, grounded in the LookML semantic model.
The LookML dependency is both a strength and a constraint. It ensures governed, consistent answers, but it requires meaningful engineering investment to set up and maintain. For teams already in the Google Cloud ecosystem, especially those using BigQuery, Looker is a natural fit. For everyone else, the LookML barrier raises implementation time considerably.
NLQ approach: Gemini-powered conversational analytics, grounded in LookML
Best for: Google Cloud-native SaaS products already invested in BigQuery and LookML
Integration: Looker SDK, iframe embed; GA as of April 2026
GoodData: AI Assistant with compliance-ready self-hosted NLQ
In May 2025, GoodData launched an embeddable AI Assistant with natural language visualization creation. Smart Search lets users explore data by describing what they're looking for. In July 2025, GoodData extended these capabilities to self-hosted deployments, addressing compliance-sensitive customers who cannot send data to external AI providers.
All AI responses are grounded in GoodData's semantic layer (metrics store and logical data model), keeping answers consistent and auditable across tenants.
NLQ approach: AI Assistant + Smart Search grounded in semantic layer; cloud and self-hosted
Best for: SaaS companies with compliance requirements needing self-hosted NLQ
Integration: REST APIs, React SDK, iframe embedding, full white-label
Qrvey: multi-tenant NLQ on AWS infrastructure
Qrvey is built specifically for multi-tenant SaaS applications and runs on AWS infrastructure. Its NLQ support is native to the platform rather than an add-on, and its multi-tenancy architecture handles tenant isolation directly. The trade-off is that Qrvey's UI customization options are more constrained than some competitors, and its connector ecosystem is smaller.
NLQ approach: Native NLQ within a multi-tenant embedded analytics framework
Best for: AWS-native SaaS companies that need multi-tenant NLQ with minimal infrastructure overhead
Luzmo: AI-assisted dashboards with lighter NLQ functionality

Luzmo (formerly Cumul.io) focuses on embedded analytics for SaaS products and has added AI-powered chart suggestions and some natural language features. Its NLQ capabilities are more limited compared to Toucan or ThoughtSpot. Better described as AI-assisted than AI-native. Luzmo's onboarding experience is fast and its dashboard builder is easy to use for teams that can accept lighter NLQ functionality.
NLQ approach: AI-assisted chart suggestions and limited natural language features
Best for: Teams that want fast-to-deploy embedded dashboards and can accept lighter NLQ
Snowflake Cortex Analyst: NLQ for internal data teams, not customers
If your data lives in Snowflake, Cortex Analyst offers native NLQ directly against Snowflake tables. It is not primarily an embedded analytics tool: there's no dashboard builder or white-labeling. Embedding it into a customer-facing product requires significant additional work.
Best for: Data teams already deep in the Snowflake ecosystem who need NLQ for internal analysts, not customer-facing deployments
Quick comparison: NLQ embedded analytics platforms 2026
| Platform | NLQ approach | Semantic grounding | White-label | Best for |
|---|---|---|---|---|
| Toucan | Conversational AI (native) | Yes (full) | Full | ISV / SaaS multi-tenant, fast go-live |
| ThoughtSpot | Spotter AI agents | Yes (TML) | Partial | Enterprise, NLQ-first products |
| Looker | Conversational Analytics (GA Apr 2026) | Yes (LookML) | Partial | Google Cloud / BigQuery |
| Sisense | Simply Ask + AI Assistant | Yes (varies) | Full | Mid-market SaaS, developer-first |
| GoodData | AI Assistant + Smart Search | Yes (full) | Full | Compliance-sensitive SaaS |
| Qrvey | Native NLQ | Yes | Partial | AWS-native multi-tenant SaaS |
| Luzmo | AI-assisted | Partial | Full | Fast deployment, lighter NLQ |
| Snowflake Cortex | Native NLQ | Yes | None | Internal analysts only |
Try Toucan for 14 days

Curious how it works in practice? Explore Toucan →
Or for a deeper look at the landscape: AI-Powered Analytics: The Complete Guide — and AI Embedded Analytics Tools if you're evaluating options.
What separates reliable NLQ from risky NLQ
The single biggest factor in NLQ quality for embedded deployments is whether the platform anchors its language model to a validated semantic layer. Without that anchor, you get hallucinated analytics: the system generates a syntactically valid SQL query that produces a wrong answer, and the user has no way to know.
Four specific things to evaluate before choosing a platform:
Semantic layer depth. Does the platform let you define business metrics, hierarchies, and terminology? Or does the LLM query raw column names? A semantic layer is the difference between an answer that reflects your business and one that reflects whatever the model guesses.
Explainability. Can users see how the system interpreted their question? If someone asks "monthly active users" and the platform shows its reasoning, users can catch misinterpretations before acting on them. Opacity is a trust problem.
Follow-up handling. Can users refine questions conversationally, or does each query start fresh? Context retention matters for real-world usage, where most business questions are iterative.
Security enforcement at query time. Row-level security should apply when the query is generated, not as a post-filter. In multi-tenant environments, a poorly constructed AI query that bypasses tenant boundaries is a data breach, not just a UX bug.
You can dig deeper into how generative AI capabilities differ across platforms. The gap between a genuine NLQ implementation and a thin LLM wrapper is significant in practice.
Build vs. buy for NLQ: the honest math
Some product teams consider building NLQ in-house, especially with LLM APIs now accessible. The appeal is control and deep integration with your data model.
The reality is messier. Building a reliable NLQ system requires a semantic layer, query validation logic, a security model, an interface, ongoing LLM fine-tuning, and continuous testing against the tail of weird questions real users will ask. That's a 12-18 month engineering project that creates maintenance debt compounding over time.
For most SaaS companies, the build vs buy calculus strongly favors buying a purpose-built embedded analytics platform, particularly when NLQ is required for customer-facing deployment, where accuracy and security requirements are non-negotiable.
NLQ as a retention lever, not just a feature
For CPOs and product leaders, the case for NLQ in your product is not about feature parity. It's about what happens when your customers can actually answer their own questions.
Customers who engage with analytics features regularly are significantly less likely to churn. Self-service analytics reduces support ticket volume. NLQ specifically unlocks the segment of your user base that will never open a complex dashboard, which is the majority of users in most B2B SaaS products.
When analytics becomes conversational, it stops being a reporting feature and starts being a core part of how your product delivers value. That shift shows up in retention metrics, expansion revenue, and NPS scores.
FAQ: Natural language query in embedded analytics
Which embedded analytics platforms support natural language queries for end users?
The main platforms supporting NLQ in customer-facing embedded deployments in 2026 are Toucan, ThoughtSpot Embedded, Sisense (Simply Ask), GoodData AI Assistant, Looker Conversational Analytics (GA April 2026), and Qrvey. Toucan and GoodData are the strongest options for ISVs who need full white-labeling and semantic grounding without heavy engineering overhead. ThoughtSpot is the deepest NLQ implementation but targets enterprise budgets.
What is the difference between grounded and ungrounded NLQ?
Grounded NLQ anchors the language model's responses to a validated semantic layer: a set of defined metrics, dimensions, and business terms that the AI must use. The model cannot answer questions outside the defined scope, which prevents hallucinated results. Ungrounded NLQ lets the model interpret queries freely against raw data, which produces plausible-looking answers that can be factually wrong. For customer-facing deployments, only grounded NLQ is appropriate.
How long does it take to deploy NLQ in an embedded analytics product?
Implementation time depends heavily on the platform. Toucan typically goes live in 2-4 weeks using React, Angular, or Vue SDKs. Platforms requiring semantic model setup in LookML (like Looker) typically take 6-12 weeks before a first NLQ-enabled dashboard is live. The difference compounds across the roadmap: a 2-week vs. 10-week time-to-production is 8 engineering sprints.
Is Power BI Q&A a viable NLQ option for embedded products?
No, for two reasons. First, Microsoft announced in December 2025 that Power BI Q&A will be deprecated in December 2026, replaced by Copilot for Power BI. Second, Power BI Embedded was designed for internal BI, not multi-tenant customer-facing deployments. White-labeling is limited and multi-tenant management requires significant custom engineering.
What is the risk of NLQ hallucinations in embedded analytics?
Hallucination risk exists in any NLQ system that relies on a generic LLM without semantic grounding. In embedded analytics, the risk materializes as a chart or metric that looks credible but is factually wrong, because the model misinterpreted a term or queried the wrong column. Platforms that enforce a semantic layer (Toucan, ThoughtSpot, GoodData, Looker) constrain the model to validated definitions, which eliminates this category of error. Platforms without a semantic layer expose this risk to every end user query.
Does NLQ enforce security across multiple tenants?
It depends on the architecture. Platforms like Toucan and GoodData enforce row-level security at the data layer, meaning the AI-generated query itself respects tenant boundaries. Platforms that enforce security only at the UI layer create risk: a poorly structured AI query could surface another tenant's data. Always verify during vendor evaluation that row-level security applies at query generation time, not as a post-filter.
Can end users ask follow-up questions in embedded NLQ?
Conversational context retention varies by platform. Toucan supports multi-turn dialogue where follow-up questions ("now break that down by region") maintain context from the previous query. Single-turn NLQ systems require each question to be self-contained. For real-world B2B usage, multi-turn support significantly improves the user experience since most business questions are iterative.
Related: Embedded Analytics for SaaS Companies | Semantic Layer for Embedded AI Analytics | Embedded Analytics: Build vs. Buy | Generative AI Analytics Capabilities

