Back


Fast & Effective Analytics for Leaders
TOUCAN IS THE "NO PHD-REQUIRED" ANALYTICS PLATFORM BUILT FOR FAST ANSWERS & LEADERS WHO CAN'T WAIT FOR THE INSIGHTS THEY NEED TO MANAGE THE BUSINESS


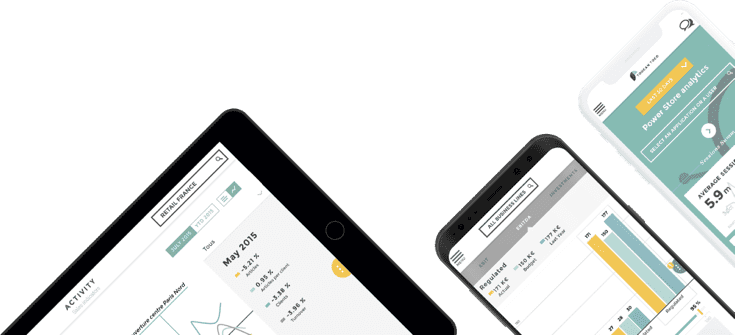
Executive Analytics
Connect multi-source data and provide actionnable insights to your C-Suite
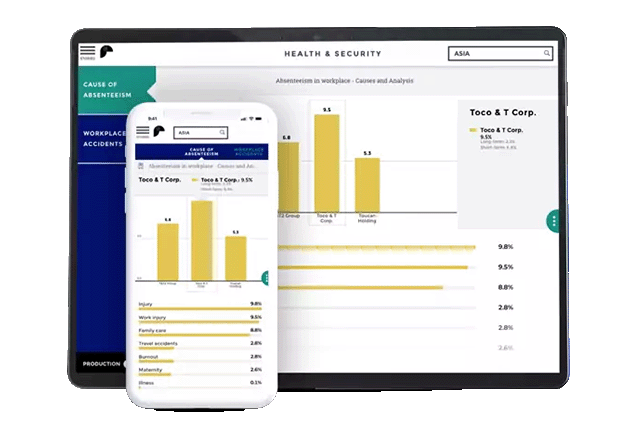
Human Resources
The dashboard to digitalize your workforce management
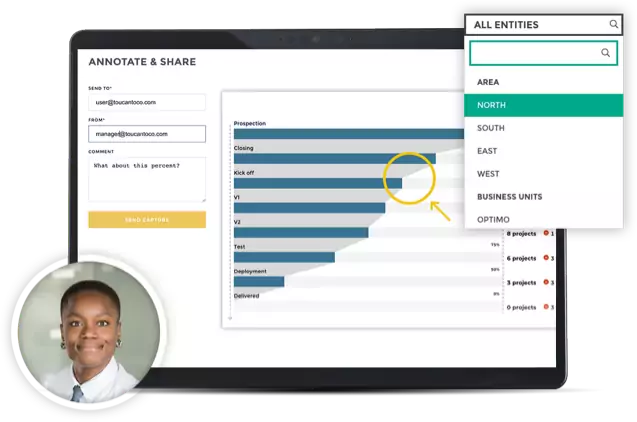
Sales Force Effectiveness
Close bigger and faster with easy, mobile-first, multi-source insights
Customer Stories


"Unbelievably impressed with how much Toucan allows us to modify. We have the ability to do anything we need to. It feels like an integrated component of our CSS."


"We rolled-out our first dashboard in less than 2 weeks and increased our sales closure rate by 10%"


"Toucan has cornered the market on customer service and without them, we wouldn't be where we are today."


"By narrating our insights, Toucan has helped the government reinforce the trust of our Citizens in the action of the States."


"We're saving 2500 hours of data consolidation per year & 700 store managers now have access to daily insights thanks to Toucan."

"We gained +0.8 in customer satisfaction thanks to clearer operations, leading to better management."
Ready to get started? Experience data stories