


Generative AI in Analytics: The 3 Best Capabilities

Alim Goulamhoussen
Publié le 27.02.26
Mis à jour le 19.03.26
3 min
Everyone is adding "AI" to their analytics product right now. But there's a difference between slapping a chatbot on top of a dashboard and actually rethinking how analytics works from the ground up.
Generative AI is one of those terms that gets used for both. So let's be precise about what it actually means — and what it changes.
What generative AI means in an analytics context
Generative AI gets thrown around a lot in the analytics space. It's worth being precise about what it actually means.
At its core, generative AI in analytics refers to systems that can create something new from a prompt — a chart, a text summary, a narrative, a query. You describe what you want, and the system produces it. You ask a question, and it generates the right visualization on the fly.
This is a fundamentally different model from the traditional analytics workflow, where everything had to be pre-built. A developer defined the query, chose the chart type, set the filters — and users consumed the result. Generative AI removes that bottleneck.
In practice, this means:
- You ask a question, the system generates the right visualization on the fly
- You look at a dataset, the system writes a plain-language summary of what it sees
- You explore a trend, the system suggests follow-up questions you hadn't thought to ask
This is the foundation of what's sometimes called conversational analytics or AI-powered analytics — and it's a meaningful shift from the traditional dashboard model.
Three things generative AI unlocks that weren't possible before
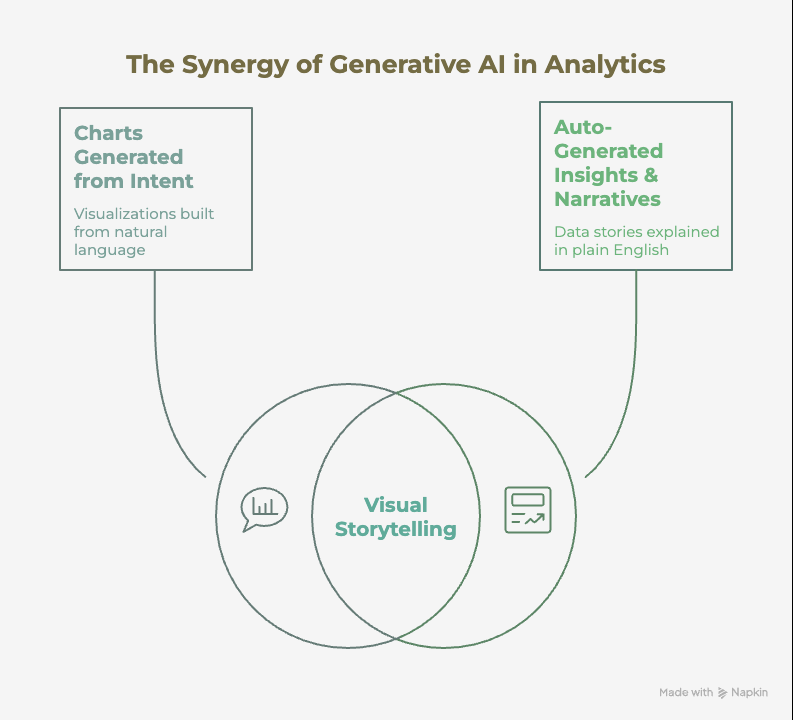
1. Charts generated from intent, not configuration
With traditional embedded analytics, someone has to build every chart in advance. A developer defines the query, picks the chart type, sets the filters. The user consumes the result.
Generative AI flips this. The user describes what they want — "show me monthly revenue by product for the last 6 months" — and the system builds the visualization from scratch. No pre-configuration required.
This is the 'chat to chart' concept — powered by natural language query technology that translates plain text into the right data request."
2. Auto-generated insights and data narratives
Numbers on a screen don't always tell a clear story. Generative AI can bridge that gap by producing automatic narrative summaries — "Revenue grew 12% MoM, driven primarily by enterprise accounts in EMEA, while SMB remained flat" — directly alongside the data.
For end users who aren't data analysts, this is significant. It reduces the cognitive load of interpretation and makes analytics genuinely actionable, not just informational.
3. Non-linear data exploration
Classic dashboards answer questions you already knew you had. Generative AI opens up exploration: you can follow a thread, ask a follow-up, pivot in a new direction — all in the same conversation, without rebuilding anything.
This matters especially in AI embedded analytics products, where your end users often don't have a data background. They can't write SQL. They might not even know what dimensions to look at. Generative AI gives them a way in.
Why it's especially powerful in embedded products
There's a version of generative AI analytics that lives in standalone BI tools, aimed at internal data teams. That's one thing.
But when you embed it inside a SaaS product — directly in the workflow of your customers — the value multiplies.
Your users aren't opening a separate analytics tab. They're getting answers in context, at the moment they need them, without switching tools. The experience goes from "here's a dashboard" to "ask whatever you need, right now."
This is where AI embedded analytics diverges from traditional BI: it's not about giving more features to data analysts, it's about making data useful for everyone who uses your product.
That's the design philosophy behind Toucan AI — building a layer of generative AI that any SaaS product can offer to its own users, without those users needing any data expertise.
What to watch out for
Generative AI in analytics isn't without its risks. A few things worth keeping in mind:
Hallucinations. Language models can generate plausible-sounding answers that are factually wrong. In a business context, a wrong revenue figure can cause real damage. Good implementations include clear sourcing, explainability layers, and — when uncertain — the system should say so rather than invent.
The solution is architectural: a semantic layer for embedded AI analytics grounds every answer in explicitly defined business logic, so the model can't invent metrics.
Governance. When users can ask any question about any data, access controls become critical. Who can see what? Can a sales rep accidentally query HR data? Generative AI needs to operate within a well-defined permission model.
Explainability. Users need to trust the output. That means showing how a chart was generated, what data it draws from, and what assumptions were made. Black-box answers don't build confidence.
None of these are dealbreakers — they're design challenges. The best AI analytics tools take them seriously rather than glossing over them.
About Toucan
Toucan AI is an AI-native embedded analytics chat. We help SaaS companies integrate analytics directly into their product. Thanks to a semantic layer and natural language question-to-chart capabilities, users can simply ask questions in plain language and get instant visual answers, without writing a single query.
For product teams, this means faster shipping, simpler integration, and an analytics experience that drives higher adoption, better retention, and new revenue opportunities.
You can request your access :)

Curious how it works in practice? Explore Toucan AI →
Or for a deeper look at the landscape: AI-Powered Analytics: The Complete Guide — and AI Embedded Analytics Tools if you're evaluating options.

