The financial executive has officially arrived.
The jumps in data adoption have occurred at an unprecedented rate. Don't believe us? C-suite executives in the have gained a new appreciation of the value of big data to their companies’ success. A 2021 survey of executives conducted by NewVantage Partners found that 31% intended to increase their investment in data and AI initiatives as a result of the pandemic, while just under 10% said their companies would spend less as a result of COVID. The survey reported that 96% of executives reported that their firms have had successful outcomes from big data and AI, an increase of more than 25% from the 2020 survey.
That's a large jump in the space of a year, and the growth shows no signs of slowing down. Experts predict that the data analytics industry will grow by over $60 billion dollars in the next year, followed by higher adoption rates. As the technology continues to evolve and match business leaders' expectations, investments will run rampant in the coming years.
Why is this relevant? Executives need quick and actionable data. Too often, we hear anecdotal stories of failed data investments, which are primarily driven by:
- The lack of mobile optimization
- Glitchy reporting
- Too many resources dedicated to data professionals
- No return on investment
With multimillion-dollar decisions being made daily by executives, new-generation data visualization tools have quickly become a favorite of business professionals. The mobile optimization that executives were seeking was finally addressed by startup companies looking to fill the void left by big data.
The following KPIs are the most crucial for small businesses looking to construct a financial dashboard that tracks multiple aspects of their business's health.
WHICH Executive KPIs SHOULD YOU MONITOR?
- Gross Profit Margin
Gross Profit Margin is a metric that analysts use to assess a company's financial health by calculating the amount of money left over from product sales after subtracting the cost of goods sold (COGS). Sometimes referred to as the gross margin ratio, Gross Profit Margin is frequently expressed as a percentage of sales.
A crucial KPI in retail, manufacturing, and hospitality industries, Gross Profit Margin is tracked religiously as a metric of success. However, this general KPI must be tracked alongside other metrics, such as revenue, COGS, and others to track the relationship between revenue and profit. Here's the formula to calculate Gross Profit Margin:

Executives should track Gross Profit Margin across all products and channels, keeping an eye on strengths and weaknesses to recall products that are not producing expected results and contribute more to higher generating offerings.
Two important KPIs to track in conjunction with gross profit margin are net profit margin and ROI on total labor cost, which offer insight into the full picture of a firm's profitability metrics.
To summarize, measuring revenue can ultimately help to:
- Measure profit after the cost of goods sold
- Offer insights on how to decrease production costs
- Monitor employee productivity and tweak production processes
- EBITDA
EBITDA, or Earning Before Interest, Taxes, Depreciation, and Amortization, is a measure that tracks a firm's overall financial health. To calculate this KPI, use the formula:

This KPI is another profitability metric that is derived from a business's financial statements. Finance departments find a firm's earnings, tax, and amortization figures on the income statement, and the depreciation/amortization figures on the cash flow statement. While this KPI is very useful as a measure of profitability, it does not reflect the cost of capital investments (ex. property, equipment). For startups whose goal is an acquisition, tracking EBITDA is an important step in understanding how an investor might view your company.
This KPI has several benefits, and helps to:
- Indicate the profitability of a firm without investments
- Directly compare your company to others in the industry
- Determine a company's debt service coverage ratio
- Accounts Receivable
Accounts Receivable is a subsection of a company's balance sheet that represents the money owed by customers for products or services that are paid in credit. The firm that supplies the product or service lists them on their accounts receivable since they will receive the money in the future.
Accounts Receivable is not a KPI that needs to be calculated, but rather tracked through accounting. To find your Accounts Receivable:
- Add up any outstanding charges
- Find the average
By tracking Accounts Receivable regularly, you can:
- Better understand your company's bottom line
- Increase efficiency and accuracy of operations
- Secure revenue by verifying and posting receipts
- Process and monitor incoming payments
- Accounts Payable
Accounts Payable refers to an account on a company's balance sheet that tracks liabilities or amounts owed to vendors, suppliers, or creditors in the short term. These liabilities must be paid in a specified period to avoid default.
Accounts Payable is an important part of any company's balance sheet. If Accounts Payable increases over a period, this indicates that the firm is buying more goods/services on credit. If a company's Accounts Payable increases, the opposite is true, with the company paying its debts quicker than it purchases new items on credit.
Guided by this KPI, you can:
- Accurately track what's owed to suppliers
- Ensure payments are properly approved
- Decrease liabilities to increase the health of a balance sheet
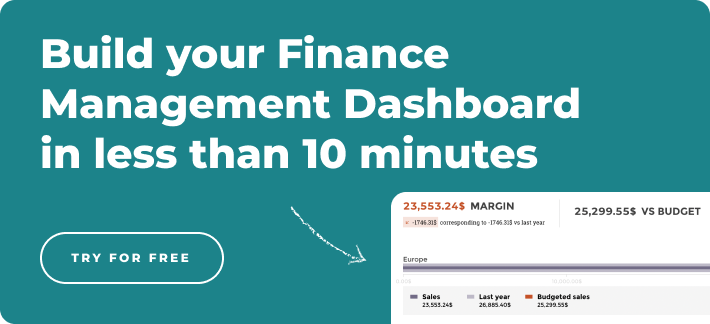
The Executive Dashboard Solution
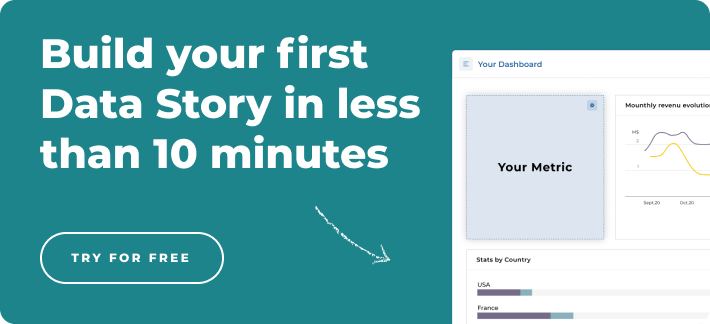
Using an executive dashboard can provide leaders in any department with actionable insights that have the power to transform a business. New generation tools like Toucan can provide small business owners a seamless dashboard building platform without the headache of a steep learning curve and data education.
Toucan’s embedded analytics works to cater to specific use cases for several industries and departments, carefully tailoring its applications to the requests and needs of a client. With rapid app deployment, Toucan’s real-time KPI tracking is extremely useful for business leaders looking to keep constant tabs on financial health. Mobile optimization also caters to busy executives on the move and simplifies complex data sets to tell a firm’s data story.
Embedded analytics to track finances is the way forward, with more business leaders adopting its perks to track crucial metrics. Don’t fall behind and miss the train, the upsides are too good to pass up.