


Financial KPIs: 9 Metrics You Should Be Tracking
.png?width=88&height=88&name=portrait_agathe_face%20(1).png)
Agathe Huez
Publié le 22.06.22
Mis à jour le 13.01.26
3 min
.png?width=593&name=webinar%20listing%20(Making%20Digital%20Change%20Visible%20in%20Your%20Finance%20Department).png)
Financial KPI tracking is an invaluable asset to any business. But of course, like with any data tracking project, those KPIs must provide accurate information in real-time to be truly effective. We’ll discuss the top financial KPIs to track and then expand on what we believe is the most accurate and efficient solution.
The finance industry is rapidly evolving and growing, with the U.S. Bureau of Labor and Statistics predicting a 15% increase to $2.1 trillion by 2029. Sounds pretty substantial right?
One of the main reasons for this growth in a largely stable industry is a more focused, data-driven approach to finance. Data is utilized for almost every financial service available, from risk management to consumer banking. However, the adoption of data analytics is still lacking, making it possible for corporations looking to get ahead on their finances to jump on the data train.
Financial KPIs for Profitability
These KPIs provide metrics for the performance of a firm’s profitability. Although most firms utilize these KPIs to discuss profitability goals internally, these metrics can be great tools to benchmark against other businesses.
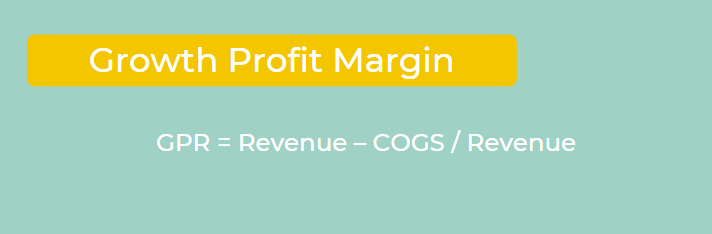
- Gross Profit Margin
This KPI measures your profits as a percentage of total sales revenue generated. This metric is great for giving decision-makers a general overview of how much profit their business generates.
Gross Profit Margin should not be used for a more detailed analysis of profit, since it does not factor in all expenses. This KPI is the most helpful in comparing your profits to those of other competitors or firms. To calculate this formula, use:
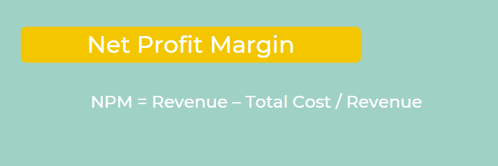
- Net Profit Margin
Net Profit Margin is the more accurate measurement of a firm’s profits for internal uses. This metric incorporates operating expenses, interest, and taxes, providing a more detailed view of a company’s profits. To calculate Net Profit Margin use:
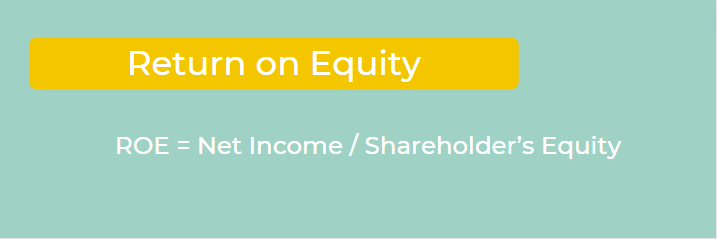
- Return on Equity
This metric measures the profitability of your business in relation to shareholder’s equity. Although it yields how profitable a business is, it mainly derives a corporation’s efficiency. This metric is useful for larger businesses that are publicly owned. To calculate this KPI, use:
Financial KPIs for Liquidity
Although profitability is key for any business, liquidity is an important measure of how efficiently your firm operates. Investors look for adequate liquidity to pay off debts or for emergency situations. Here are the KPIs that can help measure liquidity.
- Current Ratio
This KPI measures your assets (accounts receivable), against your liabilities (accounts payable). This is the main measurement to understand how solvent a corporation really is. To calculate this KPI, use:

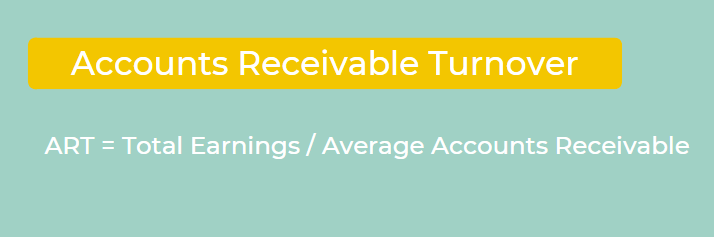
- Accounts Receivable Turnover
Accounts Receivable Turnover is the best way to measure the collection of what is owed by customers. It is advised to monitor this over a long period of time, identifying stretches when customers are taking a long time to pay for a good or service. This way, corporations can increase solvency to offset slow debt repayment. To calculate this KPI, use:
- Runaway and Burn Rate
This combination of KPIs serves to measure the amount of time a firm has to survive with its current liquidity. The burn rate is how much money a corporation is spending each month, and runaway is the number of months a firm can survive. To calculate runaway, use:

Financial KPIs for Efficiency
After measuring the two most important financial aspects of a business, profitability and solvency, you already know where your business stands. If these measurements display a healthy outlook, it’s time to measure efficiency.
Although these KPIs may seem insignificant, this is where the details make all the difference. Here are some examples of the most important efficiency KPIs.
- Revenue per FTE
This KPI gives you an idea of how much revenue each employee generates, benchmarking the amount of revenue for the size of a business.
- Revenue per Customer
This KPI measures the amount of gross revenue a firm generates per customer. Depending on the type of business, this KPI can be measured in many different ways.
For a firm with a subscription model, Lifetime Value is the most useful metric, which calculates Revenue per Customer based on how long they subscribe and how much they are paying. For firms with a more tangible good, this can be measured by recording the amount each customer has spent.
- Revenue Growth Rate
This KPI helps a business to see how quickly its revenue grows. Normally, a firm will set a benchmark in the form of a percentage and compare it to this metric to determine success. Most businesses measure this KPI on a monthly basis or a rolling 12-month basis.
Why Financial KPIs?
As we mentioned before, the financial industry is growing, and for firms who want to maximize profits, embedded analytics is the most effective and simple way to ensure that a business is financially stable. With finances being so important, especially with recessionary trends, rising inflation, and skyrocketing costs, firms need a tool that seamlessly matches their specific use cases
.
With so many options for embedded analytics tools on the market, it can be difficult to know which one to add to your data stack.
Toucan’s embedded analytics works to cater to specific use cases for several industries, carefully tailoring its applications to the requests and needs of a client. With rapid app deployment, Toucan’s real-time KPI tracking is extremely useful for businesses looking to keep constant tabs on financial health. Mobile optimization also caters to business professionals on the move and simplifies complex data sets to tell a firm’s data story.
Embedded analytics to track finances is the way forward, with many of the world’s top firms adopting its perks. Don’t fall behind and miss the train, the upsides are too good to pass up.

.png?width=112&height=112&name=portrait_agathe_face%20(1).png)
