When we look at the companies dominating the business landscape today — whether that’s tech giants like Amazon and Google or industry-specific heroes like Netflix in entertainment and UPS in package delivery — there’s one common thread. They are all seriously data-driven companies…
These companies are using analytics and visualization to understand customers, industry trends, and their own business better — and it’s giving them a serious market advantage.
In fact, companies with advanced data analytics capabilities are:
- 2x more likely to be in the top quartile of their industry’s financial performance
- 2x more likely to use data when making decisions
- 5x more likely to make decisions much faster than market peers
Now, this all sounds great, but what does it really mean to be a data-driven company, and how are these companies leading the market with data?
To answer this, we’ve put together 6 techniques (with examples) that data-driven companies use to outpace the competition.
1. They spot (and predict) new market trends first
Spotting an industry trend before the competition (or better yet, creating one) is one way data-driven companies are winning.
Analyzing customer metrics like purchasing trends, browsing history, social activity and sentiment creates valuable insights into these trends. It takes the guesswork out of spotting market trends and replaces it with concrete go-to-market evidence.
With this evidence, companies can understand what’s happening in their industry and go after the best opportunities fast.
This first-mover advantage allows companies to gain a strong footing with customers before the competition has arrived — and that translates into more sales and customer loyalty.
Cutting-edge companies are already using trend-predicting business analytics to power their marketing strategy.
Take UK clothing retailer Very.co.uk, for example. The company combined existing customer data with location-specific weather data. The result: personalized product recommendations based on the weather in each customer’s location.
The retailer displayed over 1.2 million personalized ads to customers that generated an estimated £5m.
When businesses can predict and identify these kinds of trends, they can act knowing where to best focus their efforts.
2. They identify customer experience improvements

Data analytics and visualization go beyond marketing strategies. Companies are also using business analytics to improve their customer experience.
By analyzing customer interactions — through transaction history, browsing behavior, customer service channels, etc. — they are uncovering new and unexpected ways to improve their customer service.
By communicating these findings (through data visualization and storytelling) to wider teams, everyone — designers, developers, and customer support teams — understand where the customer experience can improve.
American Express, for instance, analyzes over 100 variables in its customers’ transaction data to understand and predict future behaviors. With this information, they can forecast issues like churn and poor customer experience.
In fact, in its Australian branch, it claims it can predict 24% of the accounts that will close within four months. Using this information, they can identify why customers are at risk of churning and make improvements. What’s more, they can target at-risk customers with deals, reminders, and improved services
3. They make smarter decisions with data
Ask yourself, what happens when you make decisions with only half of the available information? The answer: your decisions are guesswork, you second-guess yourself, and the chances of getting a good result are low.
Companies at the forefront of digital transformation are leveraging business analytics and visualization to make smarter decisions.
Data visualization significantly increases the quality of decision-making. When data is available throughout an organization — say through a business dashboard — employees have access and the information they need to make critical decisions.
Equipping employees with the right information significantly increases their chances of success.
Let’s look at how the delivery service UPS uses data to make better decisions. By tracking speed, direction, traffic updates, weather, and other driver metrics, it designs the most effective routes for its 46,000-strong delivery fleet.
Because it incorporates real-time updates, drivers can make better route choices and deliver more packages, instead of wasting time in traffic.
4. They make faster decisions with data

A lack of data in decision-making often leads to something called decision paralysis — a state where people take a long time to decide because they are unsure. At a macro level, decision paralysis can slow down the entire business. But even on a day-to-day basis, each slow decision hampers employees’ productivity.
However, research shows that people process visual data 60,000 times faster than they process text-based data. So, by visualizing data, employees can understand at a much faster rate, which leads to faster and more informed decisions.
5. They identify the right growth opportunities
Being a data-driven company isn’t about customers and decision-making, it informs important strategic decisions too.
By tracking information like sales and expenses over months and years, patterns start to emerge — like when you’re busiest and when you’re slowest. These patterns can inform decisions in nearly every part of the business, for instance:
- Marketing teams can better identify their target audience and measure the effectiveness of their tactics and campaigns
- Sales teams can identify new vertices to target and plan around seasonal sales cycles.
- HR teams can analyze employee performance and engagement.
- Finance teams can monitor the financial health of the organization in near-real-time (there’s no need to wait for quarterly or annual reports)
6. They monetize their data through premium analytics to their customers
Let’s go back to UPS. Of course, they use data visualization to increase their decision-making process. But they also leverage their data to help their business users make smarter decisions.
Imagine you’re one of UPS business customers. You rely on UPS to deliver your product on time and intact because ultimately this will reflect back on your brand.
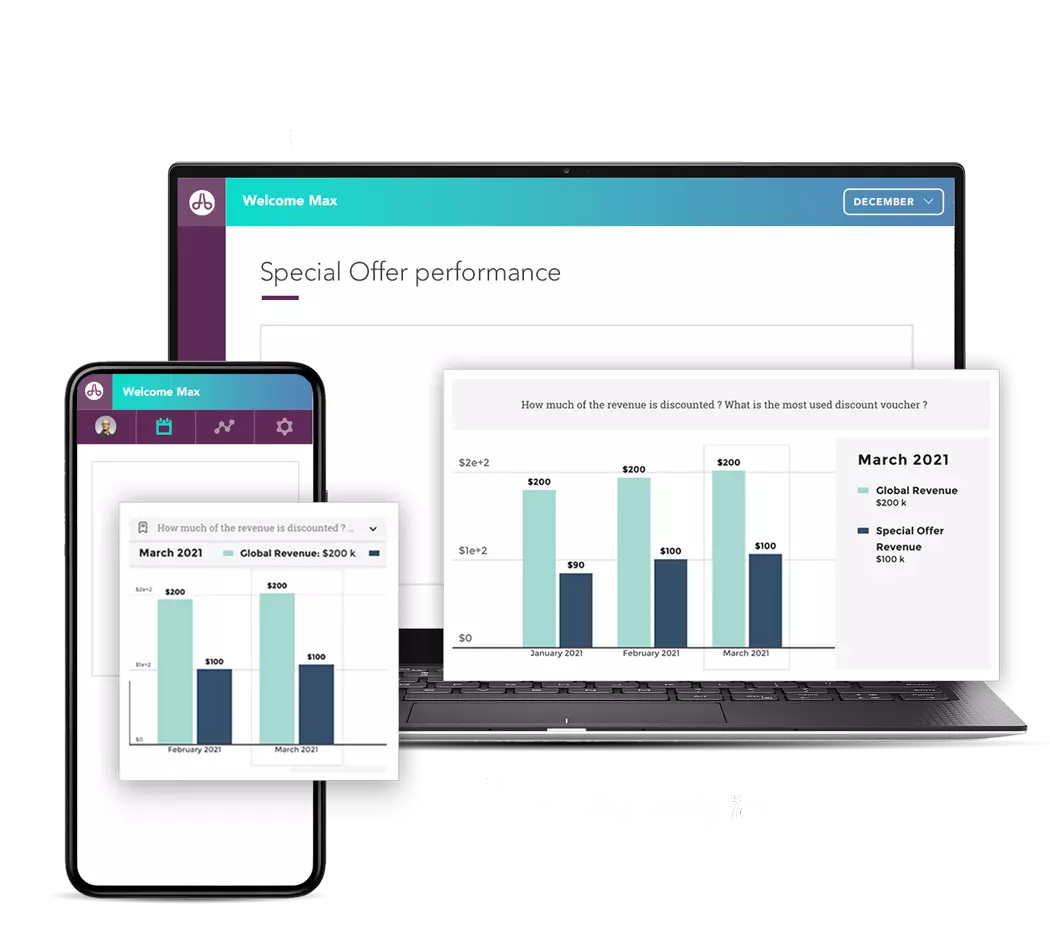
UPS lets all of its business customers access in-product dashboarding where they can access the performance of past deliveries. This is also a way for UPS to defend the value it creates for its business customers.
And UPS did it using embedded analytics so they didn’t have to build anything from scratch. And still, for their customers it’s a seamless experience, they access analytics just like you can play with the below visualization. 🙂
Data is the future
There you have it, five ways businesses are winning with data analytics and visualization. As you can see, data is playing a huge role in the success of businesses today — from user experience to predicting trends to improved decision-making. And those who choose to ignore its benefits are missing out on serious opportunities.
So how can you start finding valuable insights in your data? This is where Toucan Toco can help. We work with organizations to visualize and tell stories with data, even to the most non-technical users. Talk to us about how you can make the best use of your data today.