


Financial Dashboard for Small Businesses
.png?width=88&height=88&name=portrait_agathe_face%20(1).png)
Agathe Huez
Publié le 19.08.22
Mis à jour le 13.01.26
4 min
When people hear the phrase "business analytics," they're inclined to think of Fortune 500 companies such as Amazon, Facebook, and Tesla, which all leverage gargantuan amounts of data to generate business insights. The assumption that data is only used by big businesses couldn't be further from the truth, with 67% of small businesses spending at least $10,000 a year on analytics.
Today, more than ever, small business owners need quick and accurate access to their organization's data. The best way to provide this access is by creating a dashboard, which outlines a business's trends, financial health, and operational efficiency. For the majority of small business owners, one wrong decision could mean catastrophic consequences, making data even more important.
When creating a dashboard for small businesses, data teams are looking for solutions and templates that quickly provide insights for the businesses with smaller pools of resources. By viewing their data in one, concise package, small business owners are better equipped to remain one step ahead of the competition.
The process of creating a small business dashboard is similar to creating dashboards for big businesses. New generation tools with connectors to major data providers will yield the most effective results and provide the most accurate insights.
Why are dashboards a big deal? Let's see what the small business owners think. The use of data analytics among small businesses has been steadily increasing over the past few years. According to SCORE Association, in 2020, only 45% of small businesses were actually using analytics, while 51% of respondents considered data analytics important.
With the growth in the data analytics industry is projected to grow by over $60 billion dollars from 2021-2022, these figures will only increase as the solutions for professionals with little data experience continue to enter the market.
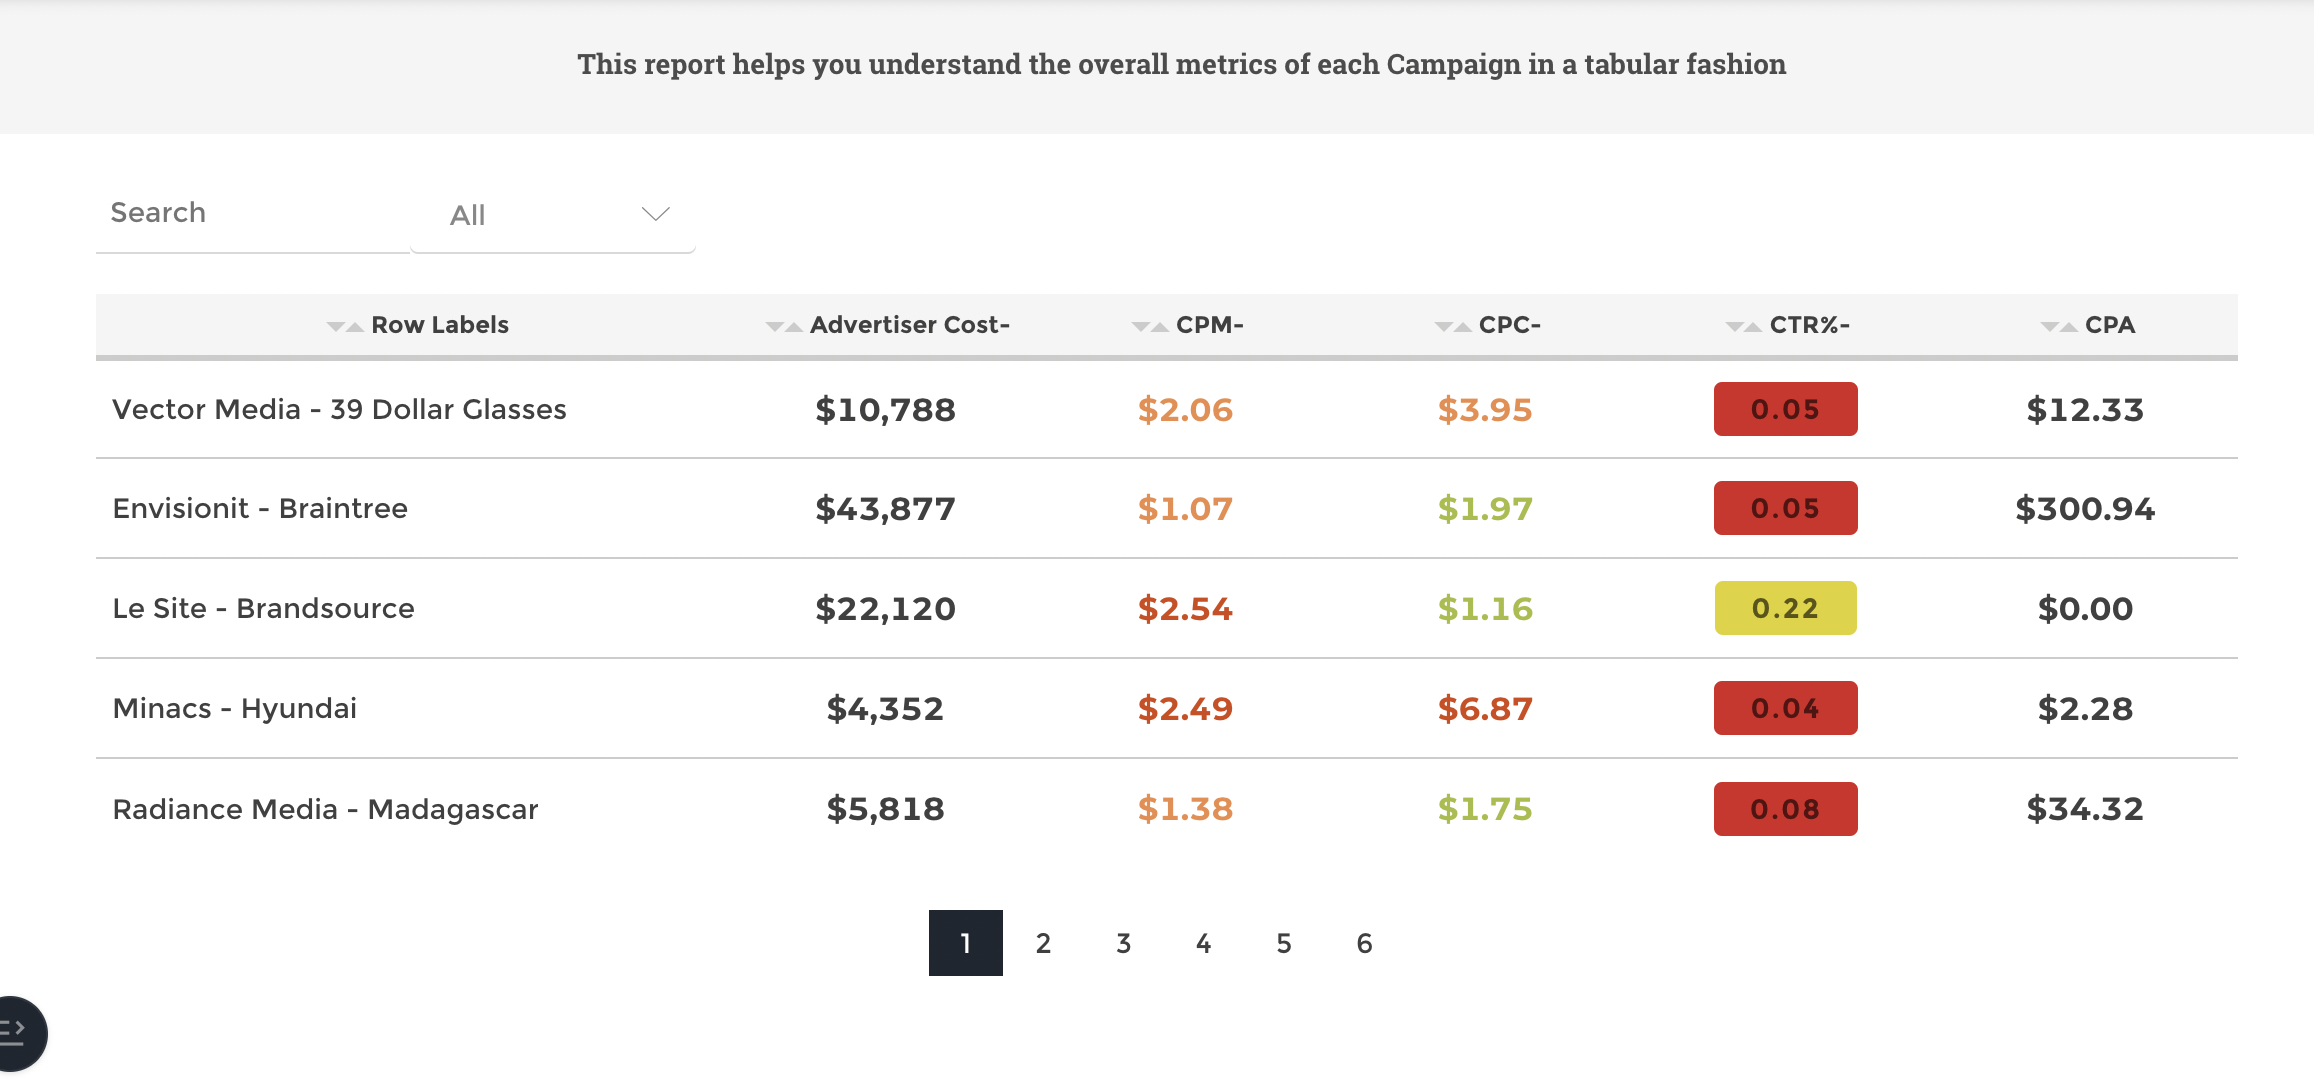
The following KPIs are the most crucial for small businesses looking to construct a financial dashboard that tracks multiple aspects of their business's health.
WHICH Small Business KPIs SHOULD YOU MONITOR?
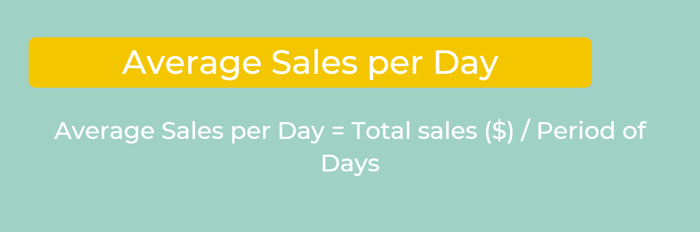
- Average Sales per Day
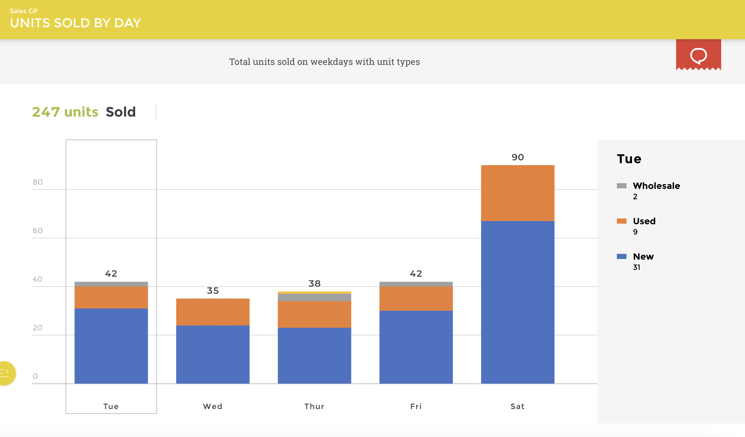
Average Sales per Day is one of the most crucial KPIs to track for small businesses. With a majority of small business workers specializing in retail and hospitality industries, it is important to track this KPI to get an understanding of sales over a specific period of time.
As the most common indicator of success, sales revenue is tracked religiously across every industry and business. However, this general KPI must be tracked alongside other metrics, such as liquidity, lead conversions, and others to ensure that revenues are being managed efficiently. Here's the formula to calculate Average Sales per Day:
Small businesses should keep an eye on average sales per day across all products and channels, keeping an eye on strengths and weaknesses to recall products that are not producing expected results and contribute more to higher generating offerings.
Two important KPIs to track in conjunction with average sales per day are net profit and gross profit margin, which offer insight into how much of a firm's revenue generates profit. Ultimately, a firm can generate higher revenues and low profits if decision-makers do not optimally manage resources.
To summarize, measuring revenue can ultimately help to:
- Track sales over a specific period of time
- Track consumer demand
- Monitor loss period(s) and better plan for profitability during rebounds
- Ask questions about revenue generation across departments
- Lead Conversion Rate
With the rise of the internet, marketing, and advertising, small businesses have more access to demand generation streams than ever before. Because small businesses don't have the giant budgets of larger firms, tracking the success of these channels is paramount to cutting costly marketing expenses. To calculate the Lead Conversion Rate, use the following formula:
This KPI measures the performance of lead generation channels such as advertising, SEO, and website traffic as a ratio of the number of leads over the number of visitors, providing small business owners with an overview of their marketing efforts over a specified period of time.
This KPI has several benefits, and helps to:
- Indicate the success of marketing channels
- Identify weak channels and optimize lead generation content
- Cut weakly performing channels
- Budget Variance
Budget Variance is a periodic measure that is used by corporations to understand the difference between budgeted and actual figures.
When speaking about variances, you’ll often hear the term “favorable budget variance”, which is a reference to positive variances or gains that you, your company, or your team realized.
An “unfavorable budget variance”, on the other hand, will be a negative variance that indicates a loss.
Budget variances occur for a number of reasons, the most obvious of which is that when forecasting, it's virtually impossible to predict future costs, and revenue, with 100% accuracy.
If you have a high favorable budget variance, you’re going to want to understand why your costs were reduced, your realized revenues exceed expectations, or why there was some mix of the two. This can inform future strategies in a positive way. Similarly, if you have a large unfavorable variance, it's vital to get to the bottom of it to make sure that you course-correct.
By measuring Budget Variance regularly, you can:
- Measure the health of your balance sheet
- Plan for negative variances
- Use negative variances to improve failing departments
- Liquidity
Liquidity is a crucial metric to any business but is especially important for small business owners to track. With looming recession fears and a quickly changing global landscape, businesses must have enough liquidity to cover any potential emergencies.
Firms will use the current ratio to track liquidity, with a higher number indicating higher levels of solvency. The following formula calculates the current ratio:
Guided by this KPI, you can:
- Measure your solvency
- Measure your firm's burn rate and runaway
- Decrease liabilities to increase liquidity
The Small Business Dashboard Solution
Using a small business dashboard can provide owners with revolutionary insights that can turn a small business into the next big hit. Although small business owners are still divided on whether data is useful to them, the industry is clearly expanding and gaining millions of adopting members each year.
New generation tools like Toucan can provide small business owners a seamless dashboard building platform without the headache of a steep learning curve and data education.
Toucan’s embedded analytics works to cater to specific use cases for several industries, carefully tailoring its applications to the requests and needs of a client. With rapid app deployment, Toucan’s real-time KPI tracking is extremely useful for businesses looking to keep constant tabs on financial health. Mobile optimization also caters to business owners on the move and simplifies complex data sets to tell a firm’s data story.
Embedded analytics to track finances is the way forward, with more small business owners adopting its perks to track crucial metrics. Don’t fall behind and miss the train, the upsides are too good to pass up.
.png?width=112&height=112&name=portrait_agathe_face%20(1).png)
