


AI Embedded Analytics that Answers Questions
Toucan lets product teams embed conversational analytics into their SaaS in days. Users can ask questions in natural language and instantly get charts with insights.

+350 companies have chosen Toucan to distribute their data


The platform
One platform. Three ways to deliver analytics.
From conversational AI to self-service dashboards to fully embedded reporting.
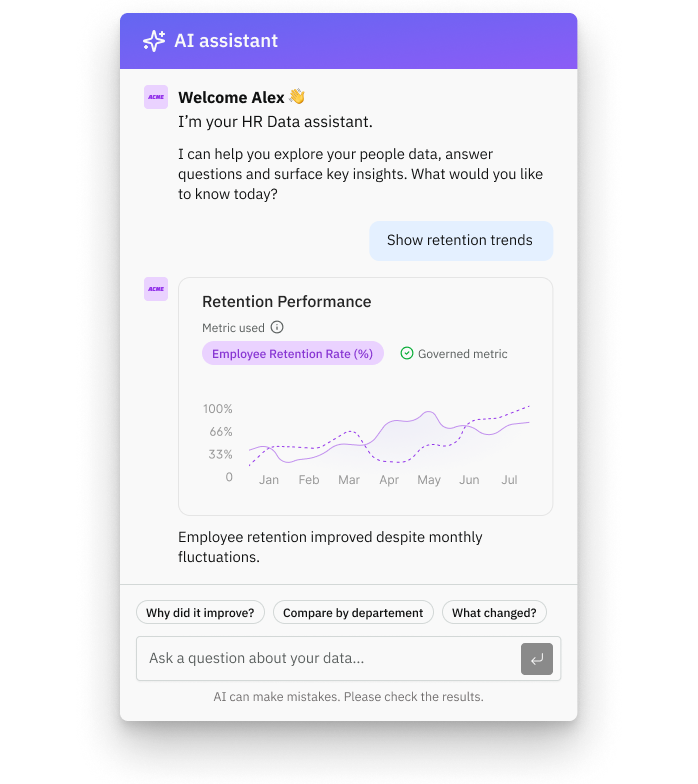
AI Chat
Your users ask. Toucan answers.
Natural language in. Instant chart out. No SQL, no analyst, no training required. The AI runs on a governed semantic layer, so answers are accurate.
- Governed semantic layer: answers are accurate, not hallucinated
- Customizable AI voice and persona to match your brand
- MCP-ready: connect your AI assistant to Toucan's analytics engine
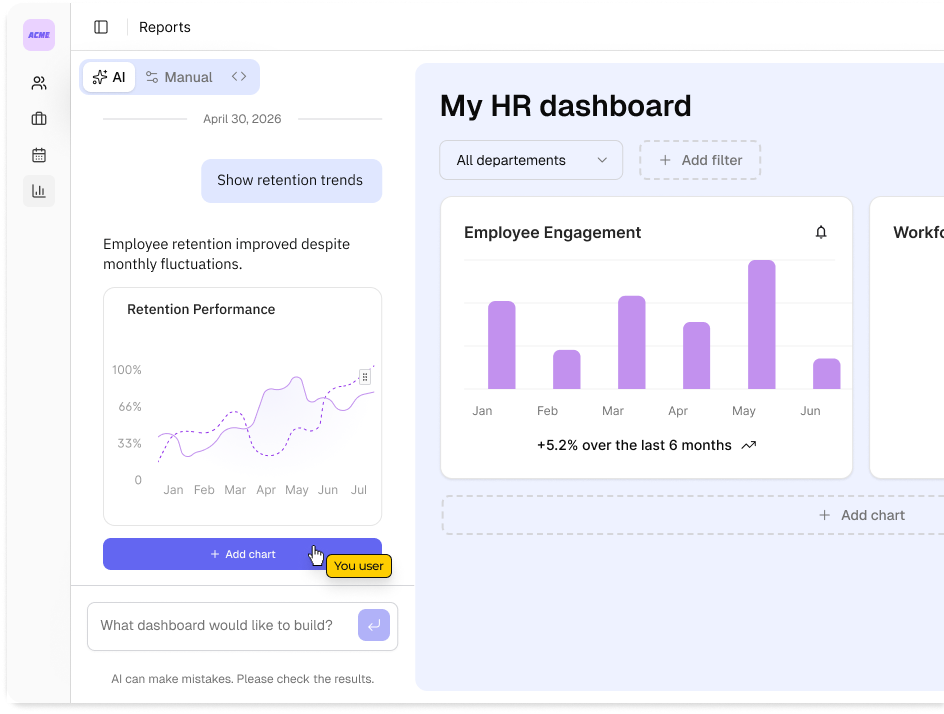
Self-Service
Let users build their own views.
End users create, customize, and share dashboards inside your product. No engineering ticket. No waiting. You define the guardrails, they do the rest.
- Build from templates or from scratch with guided flows
- Save, share, and collaborate within your product
- Guardrails you define: users explore within the limits you set
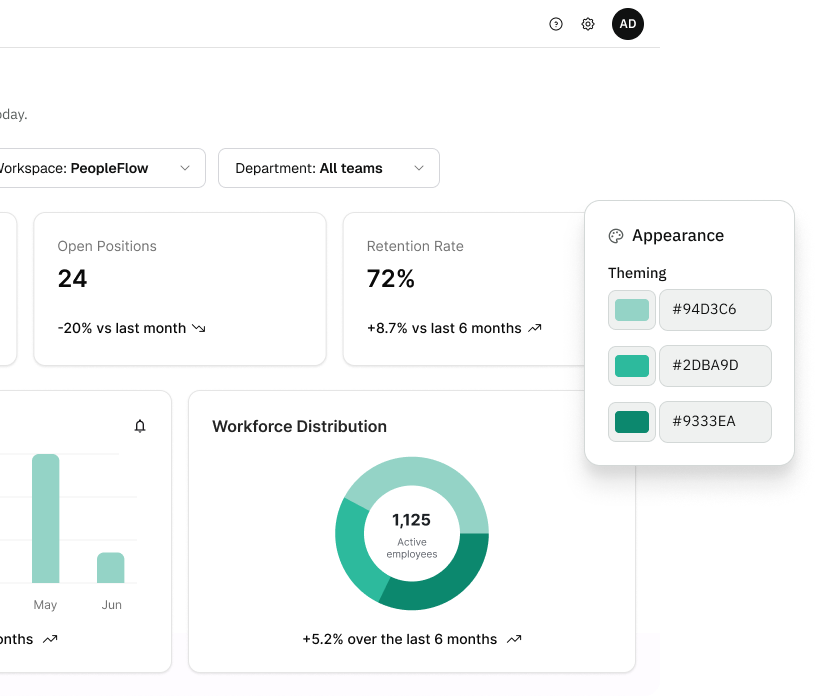
Embedded
Analytics that looks like your product.
Fully white-labeled dashboards inside your app. Your brand, your UX, your domain. Multi-tenant and production-ready out of the box.
- Multi-tenant by design: RLS and tenant isolation without custom auth
- Full theming: colors, fonts, logos, custom domain
- SaaS or self-hosted: deploy where your compliance requires
How it works
From your database to your users in days.
Three steps from your data source to your end users. No data migration, no custom BI stack to build.
1
Step 01


Connect your data
Plug in your database or data warehouse. Toucan connects directly. No data migration, no copy, no ETL to build.
2
Step 02
Configure your analytics
Define your metrics, set permissions, apply your branding. Your product team does this. No SQL expert required.
3
Step 03
Ship to your users
Embed via SDK or webcomponent. Your customers get AI chat, self-service dashboards, and embedded analytics. Inside your product.
Embed dashboard and AI chat in days, not quarters.
Product teams go live without adding headcount or burning engineering sprints.
Start your free trial
Product teams go live without adding headcount or burning engineering sprints.
< 2
weeks to roll out the first dashboard
+10%
in sales closure
"Other solutions on the market required extensive technical expertise on our end, but with Toucan, it was very easy to get started!"
VMR
250+ employees
< 2
weeks to deploy the first dashboard
30,000+
rows of real time data
"Toucan has cornered the market on customer service and without them, we wouldn't be where we are today."
DC Power
30 employees
44
data sources & dozens of users
"Extremely powerful tool-stack that allows me to make something of my data."
Willaman Solutions LLC
SMEs
20 million
data aggregations in Toucan
< 1
month to go live
"Unbelievably impressed with how much Toucan allows us to modify. We have the ability to do anything we need to. It feels like an integrated component of our CSS."

StorySlab
Software
1 million
salaries aggregated
"Toucan truly highlights survey results and helps customers regain control over their salary projects."
Deloitte
460 000 employees


Create embedded dashboard today
Turn your data into an engaging and accessible experience. Discover how Toucan can help you integrate interactive dashboards and enhance your analytics effortlessly.

Our ressources
.png)
AI Analytics
17 June 2026
9 min
How to Price AI Features Without Guessing
Pricing is the part of an AI pivot nobody wants to talk about in public, mostly because there's no clean answer yet....
Read article
.png)
AI Analytics
17 June 2026
12 min
How to Evaluate AI Features Before You Ship (2026) | Toucan
Most SaaS teams ship AI features the way they've always shipped everything else. Build it, test with a few customers,...
Read article
.png)
AI Analytics
17 June 2026
11 min
How to Build an AI Moat Against ChatGPT (2026) | Toucan
There's a question every product team building AI features eventually has to answer, whether they like it or not. A...
Read article
.png)
Product Updates
17 June 2026
3 min
Toucan Self-Service: Let Users Build Dashboards by Chat, Without Crossing Tenants
Every product team eventually hears the same request: “Can I just ask a question and get an answer?” Not a ticket to...
Read article
.png)
Product Updates
16 June 2026
2 min
Toucan's MCP Analytics Agent: Give a Data Brain to your AI Agent
Your favorite LLM can now query your data, build charts, and explore schemas. It runs on the same typed tools that...
Read article
AI Analytics
12 June 2026
6 min
How to Pivot to an AI-First Product: Lessons from Two CEOs
Most content about AI pivots comes from consultants. This one comes from two founders who did it, got things wrong, and...
Read article
.png)
AI Analytics
20 May 2026
8 min
Vibe Coding Analytics vs. Embedded Analytics: The Real Tradeoff
Executive Summary
Read article
.png)
Embedded Analytics
07 May 2026
11 min
Domo Pricing in 2026: The Complete Cost Breakdown
Read article
.png)
Embedded Analytics
07 May 2026
10 min
Tableau Pricing 2026: The Complete Cost Breakdown
Read article