


.jpg?width=88&height=88&name=PORTRAIT_Baptiste%20(1).jpg)
CEOs need quick and accurate access to their organization's data. The best way to provide this access is by creating a CEO dashboard, which outlines a business's trends, financial health, and operational efficiency. For the majority of CEOs, their missions are to exercise relevant control over major decisions and act on data to promote stability and growth.
When creating a dashboard for a CEO, data teams are looking for solutions and templates that quickly provide insights for the busiest, highest-level executives in the world. By viewing their data in one, concise package, CEOs are better equipped to remain one step ahead of the competition.
The process of creating a CEO dashboard is similar to creating any departmental dashboard. New generation tools with connectors to major data providers will yield the most effective results and provide the most accurate insights.
Why are dashboards a big deal? Let's see what the executives think. A survey of 1,300 senior executives found that while 81% of the executives agree that data skills are required to become a senior leader in their companies, 67% say they are not comfortable accessing or using data themselves. The main takeaway is that the vast majority of executives value data, but do not possess the skill to incorporate it into their daily operations.
Data technology is evolving each year, with data visualization tools simplifying the reporting process. Big data drove executives into frenzies with frequent glitches, slow reporting, and antiquated templates.
The CEOs of today expect snappy data processes that provide them with an adequate ROI. A data visualization dashboard can check all of these boxes, updating KPIs in real-time across any device. Here are some of the most important KPIs that CEOs should consider when building a dashboard.
WHICH CEO KPIS SHOULD YOU MONITOR?
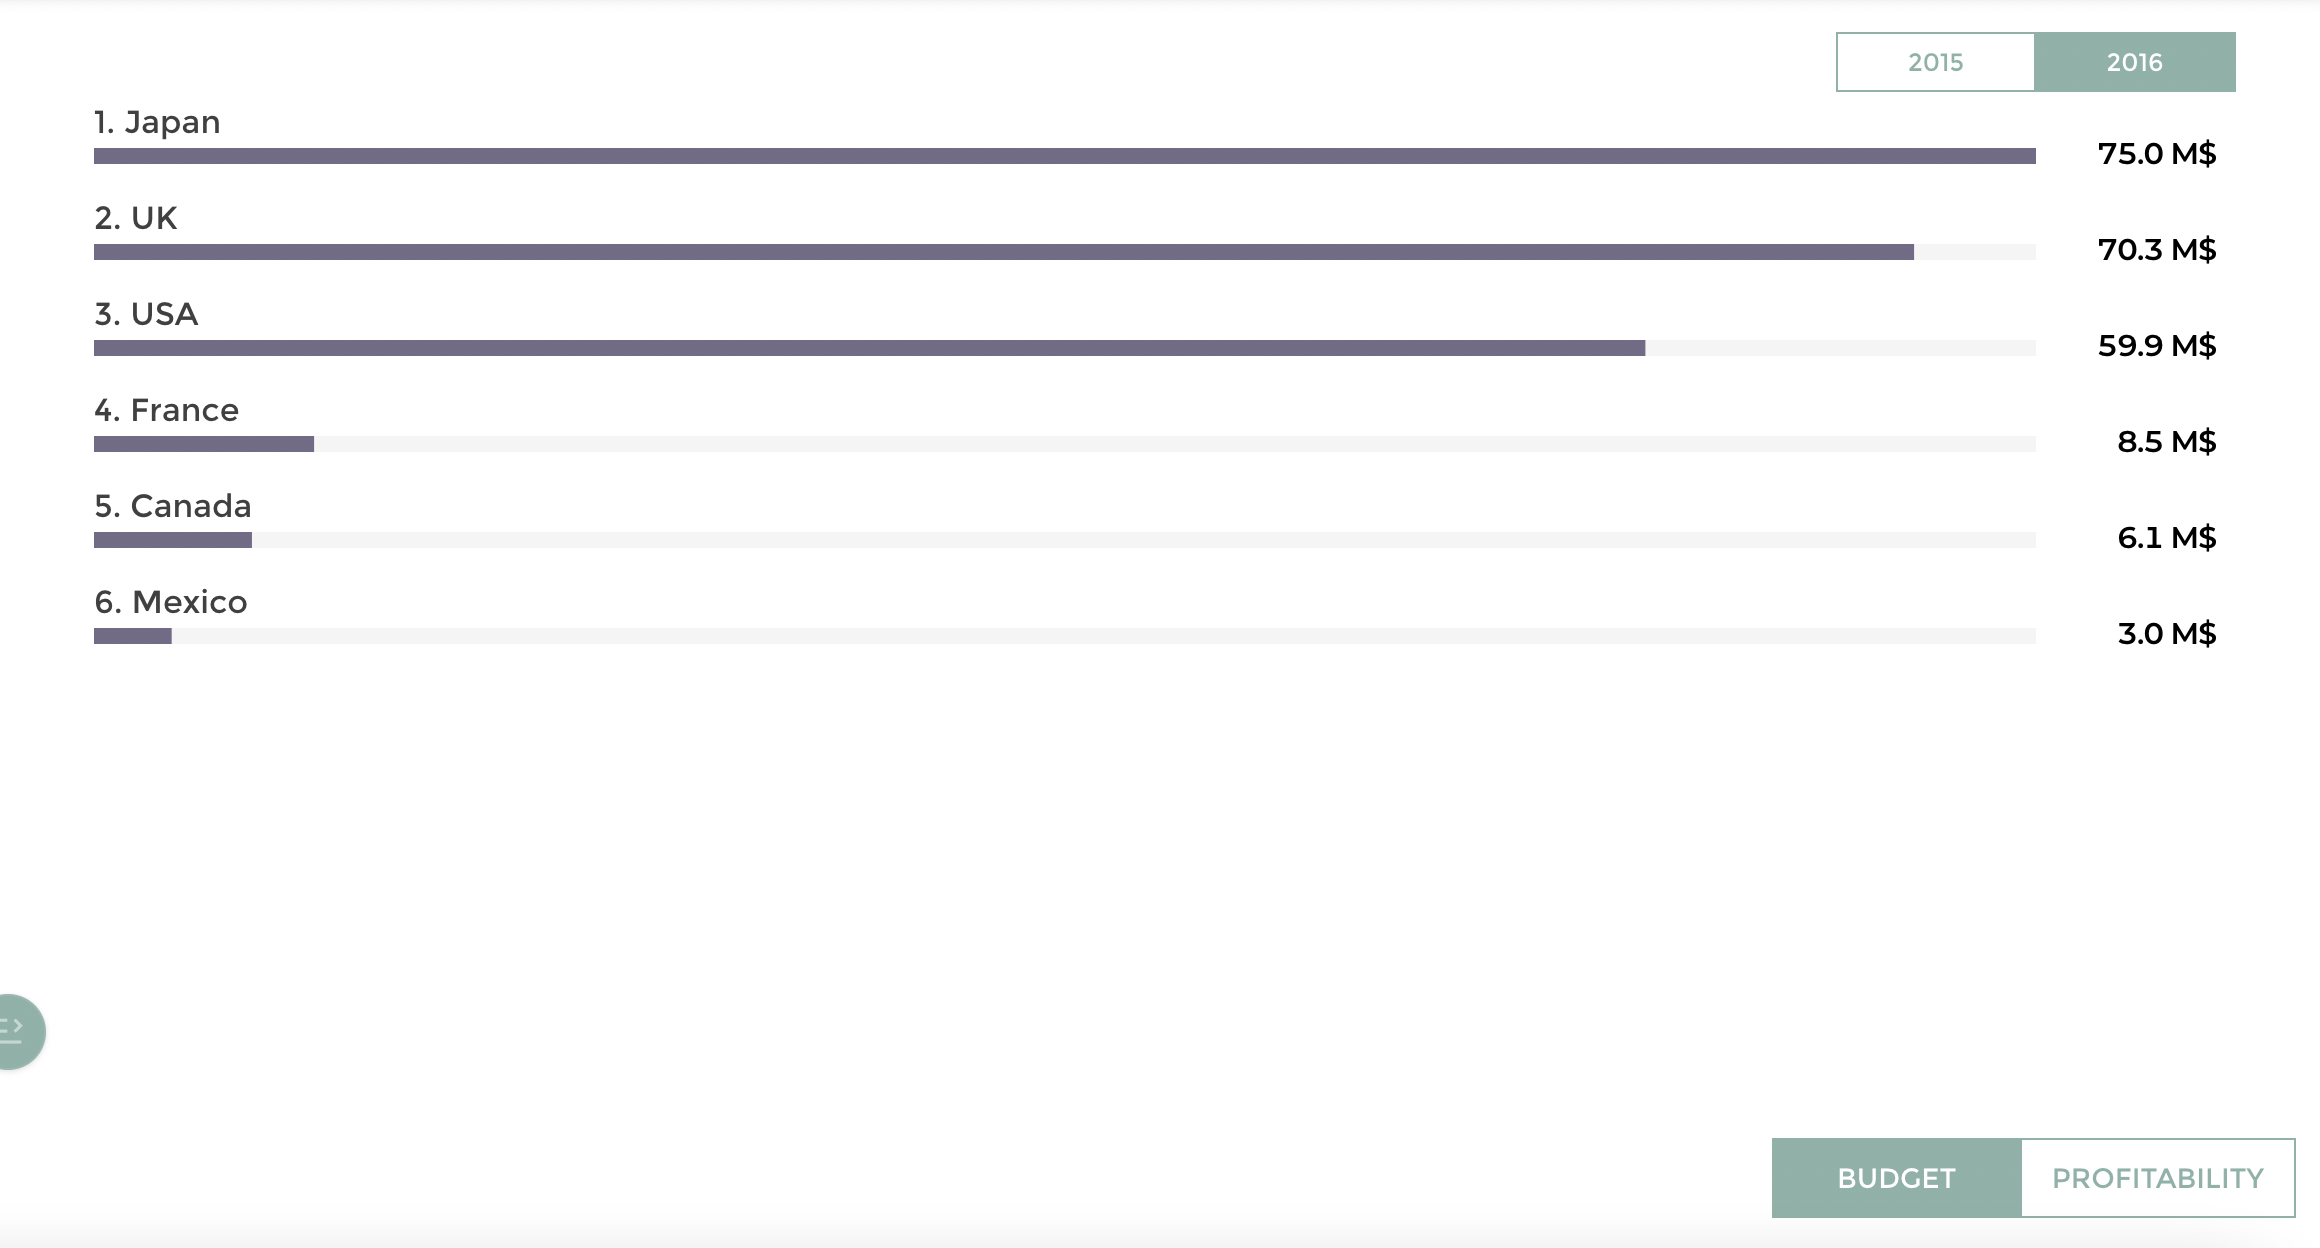
- Revenue

Revenue is arguably the most important indicator of a company's ability to satisfy demand and is measured in dollars.
As the most common indicator of success, Revenue is tracked religiously across every industry and business. However, this general KPI must be tracked alongside other metrics, such as cash flow, ROI, and others to ensure that Revenues are being managed efficiently.
CEOS should keep an eye on revenue across all products and channels, keeping an eye on strengths and weaknesses to excise any investments that are not producing expected results and contribute more to higher generating channels.
Two important KPIs to track in conjunction with Revenue are net profit and gross profit margin, which offer insight into how much of a firm's revenue generates profit. Ultimately, a firm can generate higher revenues and low profits if decision-makers do not optimally manage resources.
To summarize, measuring revenue can ultimately help to:
- Benchmark pricing
- Track consumer demand
- Monitor loss period(s) and better plan for profitability during rebounds
- Ask questions about revenue generation across departments
- Return on Investment (ROI)
CEOs have a major say in the direction of a company's investments, whether external or internal. Because these investments usually account for millions, and even billions of dollars, CEOs must track their Return on Investment to measure their success. To calculate ROI, use the following formula:
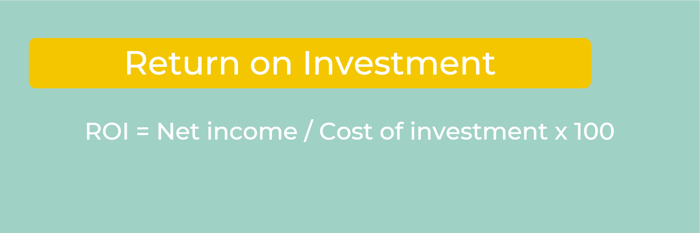
This KPI measures the performance of an investment as a ratio of net income over its cost, providing executives insight on how to move forward with their commitment after a specific period of time.
This KPI has several benefits, and helps to:
- Indicate the success or failure of an investment
- Identify weak investments and contribute more to successful channels
- Withdraw from a poorly performing investment before its too late
- Annual Recurring Revenue (ARR)
Annual Recurring Revenue (ARR) is a KPI that is important to B2B subscription business, tracking the amount of revenue generated annually by current subscribers. You can calculate ARR by using the following formula:
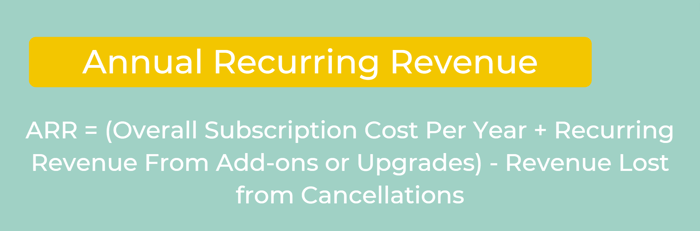
ARR is an essential KPI as it informs you as to how much revenue is generated yearly through subscriptions or contracts. The B2B subscription model is gaining popularity in the data and media industries, and ARR highlights the health of B2B businesses.
By measuring ARR regularly, you can:
- Measure the health of your subscription offerings
- Fund subscriptions that contribute more to a firm's ARR
- Benchmark recurring revenue against competitors
- Churn Rate
Customer churn is a KPI that measures the number of subscribed users (clients, contracts, bookings) that a business has lost over a period of time. Heavily discussed by subscription-based industries, this metric is also known as the rate of attrition.
Firms will use the general churn rate when disclosing metrics to shareholders or the general public, which is valuable to interested parties outside of the firm's operational scope. The formula for calculating your churn rate looks something like this:
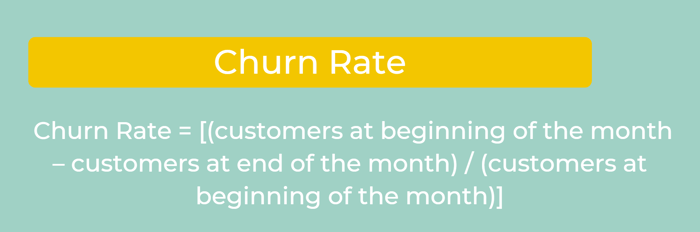
Guided by this KPI, you can:
- Accurately project revenues and profits
- Measure your firm's Customer Lifecycle
- Tweak promotions and offers to decrease cancellations
- Operating Cash Flow
Operating cash flow (OCF), is a measure of the amount of cash generated by the normal business operations of a given company.
It is generally viewed as an indicator of whether or not a company can generate enough positive cash flow to maintain (or grow) its operations. If insufficient, OCF indicates that external financing is required for the expansion or continuity of those business operations.
In other words, operating cash flow shows how well you are able to optimize daily operations. You can calculate OCF with the following formula:
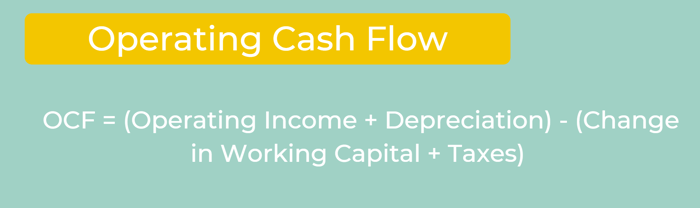
Measuring Operating Cash Flow allows you to:
- Identify efficiencies (or inefficiencies) in operation processes
- Keep a check on cash flow over a period of time
- Tweak processes to increase profits
THE CEO DASHBOARD SOLUTION
Using a CEO dashboard can shift the culture at a company from instinct-driven to data-driven. Executives are more commonly expecting leaders across every department to use data in their daily operations, but still experiencing low adoption rates and frustrations from employees.
New generation tools like Toucan can provide CEOs a seamless dashboard building platform while eliminating the big data headache.
Toucan’s embedded analytics works to cater to specific use cases for several industries, carefully tailoring its applications to the requests and needs of a client. With rapid app deployment, Toucan’s real-time KPI tracking is extremely useful for businesses looking to keep constant tabs on financial health. Mobile optimization also caters to CEOs on the move and simplifies complex data sets to tell a firm’s data story.
Embedded analytics to track finances is the way forward, with many of the world’s top CEOs adopting its perks to track crucial metrics. Don’t fall behind and miss the train, the upsides are too good to pass up.
.jpg?width=112&height=112&name=PORTRAIT_Baptiste%20(1).jpg)
