


The 5 Best BI & Reporting Tools With AWS Redshift Integration
.jpg?width=88&height=88&name=PORTRAIT_Baptiste%20(1).jpg)
Baptiste Jourdan
Publié le 29.07.22
Mis à jour le 13.01.26
6 min
Data has continued to grow in size and companies can no longer employ a simple in-house data storage system to fit all the information about their ever-expanding customer base. Not to mention how expensive in-house data storage can be. This has caused a major shift into cloud-based data storage systems, one of the most popular ones being Amazon Redshift.
Amazon Redshift uses SQL to analyze structured and semi-structured data across data warehouses, operational databases, and data lakes using AWS-designed hardware and machine learning to collect all the data in one place. But it is still just raw data. A random collection of numbers. The true value of this data can only be found when you break it down, analyze it, find trends and gather actionable insights that can be given to business decision-makers to help your company grow. But it isn’t easy to get from data to insights with context. This is where analytics solutions come in. They simplify the process of getting meaning from your data and providing actionable value to data warehouses like Amazon Redshift.
But not all analytics solutions are created equal or for the same users. Let’s see how the most popular solutions in the market stack up when used over Amazon Redshift.
01. Toucan Toco
Who it is made for: Non-technical usersData level needed: Novice
Unique attribute: Context everywhere

Toucan is one of the best analytics solutions with a 98% satisfaction rating on G2. It is built for non-technical users with a one-click integration for Amazon Redshift. All you need is the basic data warehouse information to connect your data to the Toucan analytics.
Toucan is a 0-code platform built for non-technical users with a responsive interface allowing the analytics to be viewed on any device, anywhere. What puts it apart from the other solution on this is context. There is context in every corner of the application in the front and back end. If you are a company without a dedicated team of data architects and analytics to focus solely on integrating and maintaining an analytics dashboard or solution using an Amazon Redshift integration then Toucan is the solution for you.
Toucan prompts users to take the next step in order to achieve actionable insights from their data. The presence of HKPIs, descriptions, headers, tips, alerts and a glossary makes sure that users always understand the analytics they are looking for and can make informed business decisions. Further, the comments section allows users to interact with one another without having to leave the app. If in case you want to send analytics obtained from your Redshift database to a third party, you can simply annotate and share the charts via email, slack or as a PDF.
In case you run into hurdles with the Amazon Redshift integration or analytics display the Toucan customer success team is always on hand. With a 9.9 rating for customer support on G2 Toucan is always there to help.
These benefits to Toucan's partnership with Redshift ensure a smooth analytics experience for any use case. Try out the integration now.
02. Tableau
Who it is made for: Data architectsData level needed: Advanced
Unique attribute: Customization
Tableau is one of the best analytics solutions that has been built for data architects. It has great analytics capabilities along with high data complexities. The solution is practically unusable without an advanced understanding of data architecture and analytics. The process of connecting Amazon Redshift is minimal effort if you have a deep understanding of data architecture, basic coding languages, performance test measurements and analytics layout.
Out of all the solutions on this list, Tableau does offer the most amount of customization because every aspect of the analytics after the data connection needs to be coded in Python or R by an expert. If you are a company that can set aside dedicated personnel and resources to get customized dashboards and make the most of your Amazon Redshift data, then Tableau is the solution for you. It is also imperative to hire data architects and analysts with tons of experience as Tableau’s customer support oftentimes leaves you with more questions than answers.
The only downside to Tableau is the high cost of the software and added price of personnel needed to build, test and maintain it. So if you are a small to medium-sized company it is best to look at the other option on this list.
Tableau's Redshift capabilities are smooth and efficient according to G2 customer reviews and come with a manual on the best way to optimize the connection between the two tools.
03. Power BI
Who it is made for: Data analystsData level needed: Expert
Unique attribute: BI specialization
Power BI is one of the oldest analytics solutions in the market and Microsoft’s most powerful business intelligence offering. Power BI has a simple data warehouse connection for Amazon Redshift. It isn’t one click like Toucan but the technical level needed to connect Redshift with Power BI is extremely basic. Unfortunately, this is where the ease of use ends.
Power BI suffers from a lack of evolution. The solution uses M language, a primitive coding language that adds extra steps to perform simple functions while adding to the coding difficulty. Since is an olden style of coding and viewing analytics, users need more help to navigate Power BI which the customer support team is unable to provide. The age of the analytics solution and lack of upgrades really come to light with its inability to select and move multiple objects, align objects, right-click and format objects, undo with Ctrl+Z does not work to undo, or build Gantt charts. Still, it is the only solution on this list with a 100% business intelligence focus.
If you already use Power BI or if a major portion of your workforce has experience with Power BI then it would be the best solution to put on top of Amazon Redshift as users comfortable with Power BI will find most solutions on this list hard to adopt, navigate or master.
Even with its advertised Redshift capabilities, Power BI’s questionable customer service, steep learning curve, and unreliable performance make it an inferior solution for the Redshift data power user.
.png?width=600&name=Blog%20Graphics%20(3).png)
04. Sisense
Who it is made for: Technical usersData level needed: Competent
Unique attribute: None
Sisense is a well-known analytics solution that has slowly been shifting away from business intelligence to embedded analytics. Sisense deploys elasticubes to have a more streamlined view of the data, and it is the first step in integrating with Amazon Redshift. But this is where the complications arise. Elasticubes do not allow users to create columns or change data without remaking the entire cube. So once you have integrated Redshift, it becomes impossible to change things in Sisense without upending your entire analytics.
Standard features present in all other solutions on this list seem to be missing from Sisense and needs an added Sisense Widget to be accessible. The widgets also allow for quite a bit of customization but Sisense doesn't support WYSIWYG, meaning you will not be able to see how the customized analytics will look in the final version of your solution. Even so, it is one of the easier platforms to use on this list and needs only a general understanding of data.
Though Sisense does not have one unique quality that makes it stand out, it can do a little bit of everything. This makes Sisense the ideal solution for any company that does not completely understand its needs and is looking for a jack of all trades that can set a base level of analytics. But be careful if you are going to scale, those pesky elasticubes will need a revamp every step of the way.
Looking objectively Sisense is smack in the middle of the road when it comes to Redshift integrations. Definitely not a bad place to be.
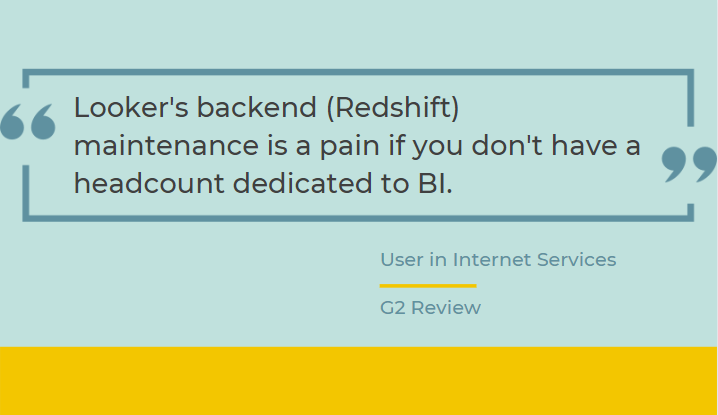
05. Looker
Who it is made for: Data analystsData level needed: Expert
Unique attribute: Exploration

Looker is a Google data tool built more for exploration than displaying analytics. This means that the Looker interface was not designed for ease of use and it shows. To start integrating Redshift, you will have to learn the customer coding language used by Looker, LookML. LookML is so different from other languages that it has an extremely steep learning curve and a dedicated developer portal to help you understand analytics on Looker.
With such a technical interface building analytics isn’t easy especially to gain actionable insights. It is made harder with customer support that is chat only. There is only so much you can explain with screenshots and text. But if you are looking to explore large datasets to understand trends and not gain business insights that are immediately valuable to business users then Looker is the solution for you. The Looker experience can be enhanced with a dedicated Looker expert on the team. This requires high monetary resources and isn't feeble for most medium to large companies looking to grow. This makes Looker the best solution on this list suited for large enterprises.
Which Redshift BI/Reporting Tool Should You Choose?
The answer is simple, whichever solution best suits your needs. Every solution on this list comes with its own set of pros and cons while fitting different company sizes and use cases. But if we had to pick one software as the best analytics solution to sit on top of Amazon Redshift, it would be Toucan.
This is not because we are biased, but rather because Toucan is the only solution that offers a one-click seamless integration and on-the-fly data manipulation to make the best use of your Redshift data as quickly as possible. Also unlike all other solutions, Toucan doesn't require a set of data experts, additional hires or extensive analytics knowledge to get the most out of your Amazon Redshift data.
.jpg?width=112&height=112&name=PORTRAIT_Baptiste%20(1).jpg)
