There are plenty of MySQL users out there. Due to its prominence as the second most popular database in the world, it forms the basis for many modern technologies. Because of its widespread use and significant impact, MySQL reporting tools have developed into an entire ecosystem designed to assist you in maximizing its potential.
It can be difficult to decide which option is right for you. Therefore, we thought we would start your search by providing you with a few things to consider and an overview of some of the best options available.
What to consider when vetting MYSQL tools
There are a variety of MySQL reporting tools available, each of which serves a specific purpose. In order to determine which tools are most suitable for you, we will consider three overarching factors:
What are your reporting needs?
In today's market, MySQL reporting tools range from enterprise-level business intelligence (BI) tools to free web-based graph and chart creators. Because of the variety of solutions available today, you'll have to decide what you want to create and whether you need a Swiss Army knife or a specialized tool.
There is a common misconception that reports and dashboards are the same thing. The two methods of reporting data are actually different but related. You'll be able to narrow down your list of MySQL reporting tools depending on which one you create.
Reports are comprehensive, in-depth, and usually static. It provides a lot of information so you can do a deep dive. By contrast, a dashboard provides a dynamic, real-time snapshot with a relatively narrow focus. With it, you can quickly make informed decisions based on vital information at a glance. MySQL reporting tools can either focus on one or provide both capabilities.
What do you already have for analytics?
Because you have so many options, you need to understand how the reporting tools you’re considering fit within your existing technology and processes. We recommend taking four things into account:
- Your team. Think about where the team is now and where they’ll be in a year or so. Keep this in mind whether you’re choosing a one-off solution or a platform that can scale as you build the team.
- Time. Often, a tool that’s light on the budget may turn out to be quite the time sink. If you need an immediate, free solution, make sure it’s also easy to use. Otherwise, it can take much longer than a paid tool.
- Technical know-how. Some tools are out-of-the-box but limited in their features and capabilities. Others are very robust, but hard to use for those who can’t code. Think about who the end users are going to be and if they can handle a complex and technical tool.
- Budget. Your options for MySQL reporting tools range from completely free small tools to expensive enterprise software.
What are you using the tool for?
You should also consider what type of data you will use, how you intend to utilize that data, and where your reports will ultimately reside.
One of the most important points to remember is that not all of these tools are secure, in particular, the free, open-source web applications. Avoid using insecure tools if you handle sensitive data, such as HIPAA-compliant or enterprise resource planning (ERP) data.
Consider using more user-friendly tools if you wish to democratize your data by making it accessible to all employees. Finally, consider what each tool is best at creating when choosing a reporting tool. The range of formats can include PDFs, embedded dashboards, or automated alerts.
5 best MySQL reporting tools
Toucan

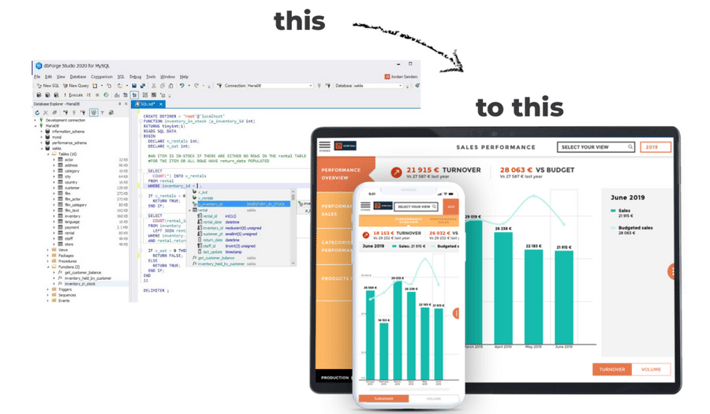
Toucan is the highest-rated analytics solution G2. Toucan provides a one-click to MySQL and seamlessly integrates with it to enable building visualizations in minutes.
Toucan is the only platform on this list created with the end users in mind. The entire platform is 0-code, making it easy for non-technical members of your team to use and gain actionable insights from it. It is a goldilocks solution ideal for everyone from large companies to startups who want to make the most of their data. This is primarily due to the fact that Toucan was made to scale.
Key Point to Note:
- Toucan has the highest adoption rate for any analytics solution on the market. This means most if not all users in your company will make data-driven decisions.
- The visualizations are easily customizable and display all data in a color-coded format to give insights at a glimpse.
- A glossary section provides more context and the comments section helps business users interact with each other in the app to ask questions, resolve discrepancies and understand data better.
“Toucan's obsession with customer experience shows at all levels of the product, from the end user and app builder perceptions, and has lead to outstanding adoption throughout the HR department.” - Raphael G from G2
Power BI
Power BI is Microsoft's enterprise-level business intelligence tool that is ideal for the creation of reports and dashboards. Its full functionality is best suited for companies looking to create multiple dashboards to get actionable insights for all the teams in the organization.
Power BI can be integrated with MySQL, but since it is part of the Microsoft ecosystem, it is more easily integrated with Microsoft SQL Server. It is ideal for large, Microsoft-based departments looking for a foundational tool to build their teams around.
Key Points to Note:
- The need to learn Mlanguage introduces an added layer of complication. This is compounded by the fact that Mlanguage is more primitive compared to other coding languages requiring more steps to build a visualization.
- Lacks basic functions like a simple way to align projects, undo operations or great Gantt charts.
- With a stripped-back design, it is fast when loading visualizations.
“There is some latency for the data to get updates when data is very large. For beginners, it is difficult to learn how to use Power BI initially.” - Power BI user on G2
Tableau
Tableau is one of the most well-known legacy BI tools that can integrate with MySQL. It is best suited for dashboarding and deep reporting. Similar to Power BI, Tableau is a large, enterprise tool that is suited for company-wide dashboards and visualizations so teams can gain actionable insights.
Enterprise teams with large data teams will find Tableau to their liking, thanks to its powerful visualization technology. Due to its reputation as being very difficult to use by non-technical individuals, its user-friendly façade has been tarnished.
Key Points to Note:
- Made for data analysts. Thus, data and visualizations feel inaccessible for non-technical users leading to low adoption rates.
- Slow to load, irrespective of your internet connection. The dashboards and visualizations become slower to load on M1 Macbooks
- Slow customer service response times, leading to months of visualization building.
“I don't like that we can't clean the data through this tool. The pricing structure can be confusing, as well as the control panel configuration if you want to host your panels locally yourself or through a VPS.” - Allison S on G2
Microsoft Excel
.svg.png?width=200&height=186&name=Microsoft_Office_Excel_(2019%E2%80%93present).svg.png)
Microsoft Excel can be used to create reports with MySQL. It is ideal for creating quick charts and graphs. It is capable of creating reports, but the process is time-consuming and not particularly enjoyable. Additionally, it is not suitable for dashboards because it does not provide real-time data.
If you have a small team already using Microsoft Office, but do not wish or need to invest in Power BI, this is an excellent option. If you wish to create more complex graphs and charts with Excel, you may need to use Visual Basic. Excel does not require much technical expertise to create some visualizations.
Key Points to Note:
- Being a free software it is not built to handle data visualizations. Building a dashboard is almost impossible.
- Most non-technical users can create a visualization for their personal use but it will not generate actionable insights for the entire team. Without actionable insists, the use of data and visualizations will not affect the bottom line of the company.
- There is no design flexibility for visualizations in Excel.
“Tired of the same old- there are some things I wish it would just do instead of having to use a million different formulas.” - Samar S on G2
Looker Studio

Looker Studio, formerly known as Google Data Studio, is a free tool for visualizing data that directly connects to MySQL. As well as creating charts and graphs, it is also capable of generating in-depth reports faster than Excel. Because real-time data must go through additional steps to be populated, you may not want to use it to create dashboards.
As it is fairly intuitive and free, Looker Studio may be a great choice for smaller teams and individuals who use Google Suite. As with Excel, Looker Studio visualizations are also versatile, but they are best used in conjunction with other Google products. Further due to the limited capabilities of Looker Studio, Google itself has a paid analytics tool in Looker. In an effect to differentiate the two Looker has its own coding language making it ineffective in working with MySQL to create visualizations.
Key Points to Note:
- It is a free software focused on handling data and creating visualizations.
- Being free it comes with limited features and no customer support. If problems arise you will simply have to as the online Google forum.
- The designs available for visualizations are limited and often come off as cluttered leading to a lack of actionable insights for the team.
- Best suited for single users or very small companies who do not have the budget for an analytics tool but would like to have visualizations.
“Some of the connectors are SUPER slow, and the cloud for mysql connector is so slow and breaks a lot.” - Looker studio user on G2
Benefits of Using a reporting tool for MySQL
Innovative MySQL reporting tools can benefit your company in many ways, and the ease of use is just the beginning:
- No data analyst needed: The traditional method of conducting complex queries required your company to employ a data specialist, which could take hours, if not days. With Toucan’s MySQL reporting tool, anyone on your team can build queries and analyze the data, regardless of their technical expertise. An innovative 0-code interface allows you to simply select the data fields and visualization type to measure your KPIs and the tool handles the rest automatically. You will receive real-time information that is designed to deliver actionable insights.
- Real-time insights: The ability to visualize the quantities of data you deal with on a daily basis is an invaluable asset in the analysis process. With MySQL reporting tools, you can go from static reporting to active, value-added business intelligence. Classic reporting presents static information that is often out of date. A comprehensive view of your organization's data will be provided, giving a holistic view of the data that makes up your business.
- Quick setup: You only need to connect your MySQL database to set up tools such as Toucan, which takes under 10 minutes with its one-click integration. Once the setup has been completed, you are ready to begin running MySQL queries and building out visualizations. Your entire analytics can be up and running for the entire organization within a few weeks.
- Complete MySQL reporting: The use of paid analytics tools will allow you to carry out even the most complex queries in a much shorter period of time, and they will provide a variety of sharing options, such as annotating and sharing via PDF or Slack, which will save you valuable time. By doing so, you will further be able to free up resources that can be used to focus on your core business areas, which will ultimately help you increase revenues and provide you with a complete MySQL analytics dashboard.
- Data-driven decisions: While you are on the go, you can run queries, create stunning charts and graphs, view them on your business intelligence dashboards, and send out reports within moments to your colleagues. As a result, you are able to make ad-hoc, data-driven business decisions wherever you are - at home on a tablet, at work on your computer, or on the move using your smartphone.