


Evolution of Business Intelligence: What Are the Generations of BI
.png?width=88&height=88&name=portrait_agathe_face%20(1).png)
Agathe Huez
Publié le 02.11.22
Mis à jour le 13.01.26
5 min
Business Intelligence (BI) tools play a critical role in helping organizations make data-driven decisions. However, the BI world is far from easy to navigate. Although the generations of BI tools have brought innovation and increased capabilities, most businesses are still looking for a BI solution that matches their needs.

The methodology of BI tools falls under two main categories:
- Self-service (operational teams can operate the platform)
- Outsourced (hire team members or an IT provider to generate quality data for operational teams)
Why the two different approaches? Unfortunately, data is complex. If operational teams are not confident in their ability to utilize their BI tool, they will lack trust in their insights and slowly phase it out of their workflows.
Although we’re painting a bit of a bleak picture when it comes to the BI landscape, there is good news. Data is simply getting better and emphasizing usability by decision-makers to increase adoption rates. The verdict is out: operational teams cannot rely on data teams for insights.
This sounds great, but how can we make that ideal scenario a reality? To understand improvements in BI, one must understand its evolution throughout three clear phases: traditional BI, self-service BI, and augmented analytics.
The Evolution Of BI
Before we dive into BI’s evolution, let’s establish what BI tools really are (yes it can be confusing). Business intelligence can be defined as a tech-driven process created to analyze data and generate guided insights for decision-makers. By feeding data about your business to a BI tool, you can unlock insights that will tell you what products are underperforming, how many new stores to open, and virtually any other decision that can be made with the help of data.
Now that we’re on the same page, let’s dissect the journey of business intelligence tools and what BIs evolution means for business owners, decision-makers, and employees across every vertical.
Traditional BI
Traditional BI relies on databases to analyze data and create static dashboards. With a traditional BI tool, decision-makers establish KPIs to answer their most pressing business questions. The biggest downside to traditional BI was its instability to be effectively used by the non-technical user. The biggest players in the data space, including Microsoft, IBM, Oracle, and others were the catalyst behind the emergence of traditional BI.
The two most crucial factors to the success of traditional BI included:
- Dashboards and Reporting: Traditional BI tools used advanced coding to manipulate data into dashboards, which could later be used for reporting.
- Data Warehousing: The emergence of traditional BI required companies to understand where and how to store their data. Database management systems allowed them to do just that, enabling the analysis of large data sets and drill-down reporting.
Traditional BI tools fell flat because of one prominent reason: operational teams relied fully on data teams to extract insights. Data teams created a bottleneck for operational teams; whenever there was a concern or request, data teams were the only ones who could execute tasks. Traditional BI tools were very complex, requiring expert-level knowledge of SQL to manipulate data sets.
A common workflow for a traditional BI tool would look something like this:
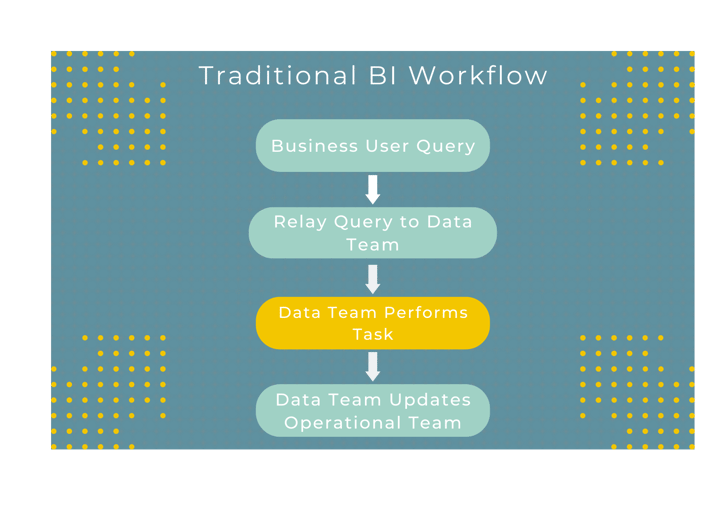 Because of the complexity, inconvenience, and inefficiency of this workflow, the next logical step in the evolution of BI was to put more power into the hands of operational teams.
Self-Service BI
Business intelligence providers heard the cries of frustrated business users, and they worked to fix many of these issues.
Static dashboards were too primitive for the needs of the modern business. With self-service BI tools, dashboards could be updated in real-time through cloud connectors. The automation of data importing with the help of data warehouse modernization eliminated an important bottleneck for operational teams.
Self-service BI tools made the data import process friendly for the non-technical user, but did it do the same for data manipulation and visualization building? Yes, but it’s complicated.
There is no question that self-service BI was easier to use than its archaic predecessor. Non-technical users could now access their data sources and possess more control over their reporting and dashboard building. This is largely due to the simplification of BI platforms and the reduction of code-heavy processes.
Self-service BI tools aimed to be the one-stop-shop for data platforms. The creation of self-service BI allowed companies to cut down their tech stacks. All that business users needed was a data warehouse and a self-service BI tool to unlock far more insights at a faster rate.
Onboarding was also an issue that self-service BI resolved. Traditional BI tools took years to master, and even then, data teams ran into problems. Self-service BI tools made it easier for the non-technical user to learn data workflows in months, making BI more accessible and adoptable by the everyday user. Although self-service BI tools were much easier to use, they were still technical and required intensive courses to learn, especially for non-technical users. Data teams were still widely employed to help with more technical tasks like data preparation and modeling. Because of a continued reliance on data teams to extract insights, many business users felt deceived by the self-service label.
The workflow for self-service BI looks like this:
 It’s unquestionably a monumental improvement over traditional BI.
Although self-service BI tools were a step in the right direction, operational teams still relied on data teams to complete technical tasks. The third generation of BI understood the demand for a truly self-service BI tool, and data companies set out to achieve that goal.
Augmented BI
This is where the evolution of BI takes a more psychological approach to data and insights. The best way to explain augmented BI is to compare it to the “IKEA effect.” The IKEA effect refers to the physiological phenomenon of valuing something that we create. For example, a homeowner is more likely to tend to their IKEA furniture because they were involved in assembling it. With traditional and self-service analytics, users are more isolated from dashboard creation and modeling. Augmented BI seeks to put every aspect of the data pipeline into the hands of business users.
This approach has been revolutionary for businesses, who notice the difference between forcing users to use BI tools and users showing interest in using them. Augmented BI allows users to create a self-service pipeline that extracts data from many sources, automatically processes and organizes it, and finally builds the visualizations themselves.
Let’s compare this to the IKEA effect. Remember how operational teams distrusted traditional BI? Augmented BI completely reverses this mistrust. When operational teams build their own automated pipelines and control the processes of data modeling, they are more emotionally invested and sure of the generated insights.
This philosophy is exactly what we modeled Toucan’s augmented BI platform after. Instead of handing our clients a platform and leaving them in the dark, Toucan’s focus is true data democratization. The only way to achieve true data democratization is by placing a 0-code platform in front of the non-technical user, allowing them to follow every step in the data process.
Toucan’s data visualization allows non-technical users to build their data visualizations from scratch through seamless 1-click integration from data sources (AWS, Snowflake, PostgreSQL, etc.) The everyday business user is much more likely to trust a self-created visualization, dashboard, and report based on the cognitive bias of knowing that they are error-free, visually appealing, and easy to understand.
Why Should You Invest In An Augmented BI Tool?
Augmented BI is the simplest way to create a data-driven culture that is defined by efficiency and democratization. Companies that invest in traditional and self-service tools experience what is commonly known as the “data headache.” Workflow overload, data team bottlenecks, and business user frustration all contribute to painfully low adoption rates.
At Toucan, we emphasize the non-technical user by surrounding them with the features and capabilities they need to make the data experience worthwhile and effective. Toucan’s platform includes collaborative capabilities such as comment sections and annotations directly within the app, as well as instant sharing via email, Slack, and other communication channels.
Most importantly, Toucan users own every aspect of data visualization. What does this mean for you? You won’t doubt your visualizations and reports anymore. No more clunky PowerPoint presentations, failing visualizations, and reporting processes that take months. You own all aspects of your dashboards on every device, anywhere. Trust is everything in the data process and augmented BI platforms like Toucan are finally putting data in the hands of the decision-makers that actually benefit from insights.
.png?width=112&height=112&name=portrait_agathe_face%20(1).png)
