


Business Intelligence Reporting: are you doing it right?
.jpg?width=88&height=88&name=PORTRAIT_Baptiste%20(1).jpg)
Baptiste Jourdan
Publié le 08.12.21
Mis à jour le 13.01.26
6 min
If you’ve set out to develop and implement a business intelligence strategy for your company, then you’re probably wondering how to gather the data you need in order to understand your business. You’re looking for the best way to centralize, prepare and analyze this data and draw relevant conclusions from it. But one aspect of BI should never be taken lightly: reporting.

It’s one thing to devise a strategy for the way you’ll manage your data, and another to decide how you’ll get the most relevant information and insights in front of the people who need them. Even the most insightful data analysis will not change your bottom line if your company’s business users don’t have access to it.
This is exactly what BI reporting is: sharing your most important BI metrics with stakeholders so they can draw important conclusions from them. Depending on what you’re trying to measure (sales, revenues, new hires, length of outgoing sales calls…) BI reporting allows you to apply a specific dimension to these metrics (time, location, branch, type of customer, type of product) so you can cross-reference these numbers and compare them. Traditionally, BI reports were prepared by IT professionals and intended for high-ranking executives and board members, but the world of BI is becoming more democratic, and it is now expected for anyone across the company to have access to BI reports (or generate their own) autonomously. Are you wondering if you’re doing BI reporting right? Or are you unsure where to start? We’re walking you through it all in this article.
Assessing your current BI reporting
The first step in improving your BI reporting is to understand where you stand now.
What kind of reports are currently being shared and used within your organization? Static reports are a basic form of reporting: they’re these PDF reports or Excel spreadsheets that are periodically sent out to business leaders so they can monitor the performance of their area or department. Usually, static reports are prepared by IT or data professionals who need to dedicate time and energy to this, even though some BI tools allow for the creation of automated reports. These static reports can be an example of managed reporting: business users are not independent in accessing their data, they need the help and intervention of IT. This state of affairs usually creates a backlog of requests for IT and mounting frustrations on both sides: business users have to wait several days before getting an answer to their most pressing questions and IT teams have to dedicate more and more time to creating these reports instead of diving into more valuable tasks. At the opposite end of the spectrum, self service reporting allows business users to create the reports they need by themselves, without reaching out to IT or data teams. This is usually made possible through user-friendly dashboards that can be updated automatically, as opposed to reports (but more on this later).
Whether your company relies on static reports or dashboards, and whether your BI reporting is managed or not, you need to understand if the current system is the right one for you. Don’t hesitate to sit down with stakeholders (both on business and IT teams) and ask them how they feel about the way things work.
What your BI reporting should do for you
No matter what type of reporting you ultimately end up going for, it is crucial that your BI reporting system accomplishes these things. Only then will you be able to reap the benefits of your BI strategy:
- It allows you to get your BI insights in front of the right people at the right time
- You can blend different data types and data sources together, breaking down data silos and creating one unique source of truth
- Your business users can understand complex BI insights quickly and easily
- Turning to BI reports before making big or small decisions becomes a habit: you’re able to successfully promote data culture across your organization.
Best practices to keep in mind
Now that you have a clear idea of what a performant BI reporting strategy looks like, you’re probably wondering how to go about implementing yours. As you might suspect, there’s no one-size fits all answer to this question. It depends on the structure of your organization, your data architecture, and the data literacy level of your employees. Here at Toucan, we like to help our customers implement BI reporting tools that work for them depending on all of these factors. And while no two BI reporting strategies are the same, there are certain overall principles that hold true for everyone.
Make business users independent
Depending on the structure of your company and the type of data you have at hand, you might choose to go for managed reporting. Maybe you handle sensitive data and not feel comfortable with anyone except your BI team working with your data directly. But even if you have to implement strict security rules, we encourage you to give your business users more independence in accessing the reports they need directly without any help from IT teams.
Take advantage of the cloud
There has been a big revolution in the world of enterprise BI in the past few years: the cloud. Originally, most big companies initially preferred to store their data on-premise for security reasons. But cloud solutions have improved enough to afford companies the same level of security as on-premise storage. The cloud is where the most innovative solutions in terms of data infrastructure are (think of modern data warehouses that allow you to structure your data and retrieve it easily). If your data is already on the cloud, then it might be a good idea to look for cloud-based BI reporting solutions too: often, they come with built-in connectors that will allow you to retrieve your data right at the source.
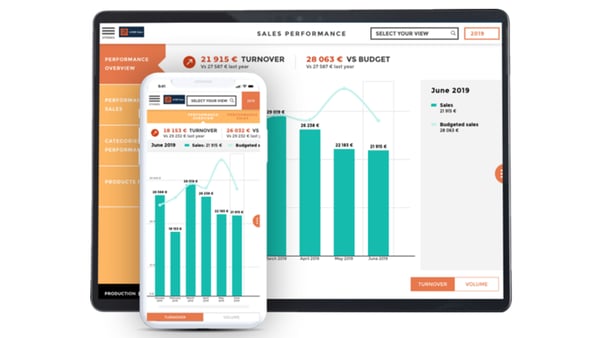
Create compelling dashboards
We’re big believers in the power of dashboards. While there’s something to be said for static reports that regularly get mailed out to important stakeholders, dashboards are the ideal solution for modern reporting: they’re the most appropriate for self-serve BI reporting, they’re easy to update regularly (or in real-time), and most of all, they’re interactive, allowing users to zoom in and out as needed to draw the right conclusions. But all dashboards are not created equal: there are certain rules to follow if you want to create compelling dashboards with high adoption rates: head here to read our advice. And if you’re keen on having regular, automated reports that follow a certain format, then you can program your dashboard to build them and mail them out. Head here to read our best practices for building efficient dashboards.
Tell contextualized data sorties
Let’s face it: most people expect BI reports to be rather boring. They’ve gotten used to lengthy and dense spreadsheets that offer little to no context. Surprise them by turning your reports into data stories: yes stories, with context, a beginning, an end, and clear conclusions to draw. Here at Toucan, we’ve worked hard to perfect the art of data storytelling: we think reports should be read like books. This means we work hard to make our reporting clear, simple and understandable. In order to do this, you’ll need a blend of data visualization, UX, and a willingness to explain and contextualize each metric in order to make it accessible to everyone.
Make BI available on the go
The mobile revolution has reached the world of business. Gone are the days when executives were tied to their desks and present in the office from 9 to 5. Technology has become ubiquitous, and most of us are used to navigating between one device and the other. We now have the same expectations for our professional lives and expect our tools and resources to be available wherever we are. This is particularly true for sales executives and representatives, who routinely visit their clients, and need to have access to important information that might help them seal important deals. Your BI reporting should be available on mobile if you wish to make their lives easier and see the effect of your BI strategy on your bottom line. Head here to read about mobile BI.
Make it easy to take action
We’ve said it already: the aim of Business Intelligence strategies is to help you take relevant actions that will make you more efficient. That’s the end goal of any BI report. Ideally, BI reporting should spur immediate action. Some BI reporting tools understand this and turn their dashboards into action centers.
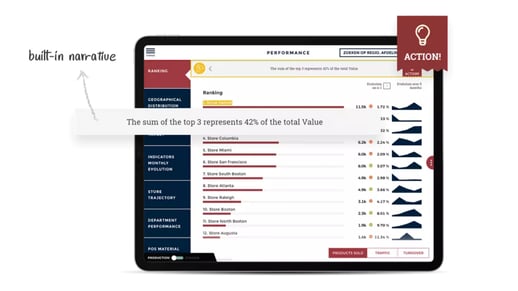
This means making it easier to share relevant numbers with team members, to comment numbers and to start discussions. Remember that reports should be more than mere reports, and allow you to improve your bottom line. Follow the example of these 4 successful companies that have used BI to their advantage.
Choosing the right BI reporting tool
With all of this in mind, you set out to look for the perfect BI tool for your organization… And you realize how easy it is to get overwhelmed by the many offers available on the BI market: you have to compare 350+ analytics solutions that promise you more or less the same thing. Are they all equivalent? The answer is no. Some of them make it harder for you to understand and leverage your data by introducing needless friction: simple processes become unnecessarily complicated and costly. You should look for a platform that puts clarity and ease at the center of their value proposition. While analytics can sometimes be complicated, BI reporting should be simple for everyone involved. But don’t take our word for it, you can simply try out our frictionless BI reporting tool for free here:
.jpg?width=112&height=112&name=PORTRAIT_Baptiste%20(1).jpg)
