


Mobile Analytics Dashboards: A Comprehensive Guide
.jpg?width=88&height=88&name=PORTRAIT_Baptiste%20(1).jpg)
Baptiste Jourdan
Publié le 12.07.22
Mis à jour le 13.01.26
5 min
A mobile dashboard is a data visualization tool that allows a user to track KPIs in real-time across all devices. More than ever, corporations prioritize mobile optimization across every device for a seamless data experience.
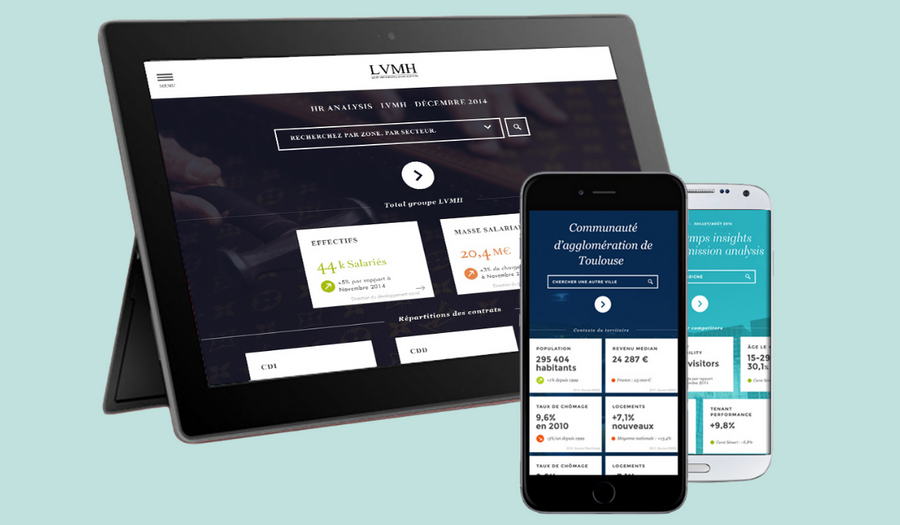
It's no secret that our phones and tablets are on their way to replacing the traditional desktops, with employees raving about how their iPads revolutionized their workflows. As corporate employees travel more than ever after the COVID-19 pandemic, mobile workflows are bound to become even more popular.
Change is already here. According to Career Builder, 70% of employees keep their phones “within eye contact” at work, while 91% of corporate employees are using at least one mobile app. With the data pointing towards corporations including more mobile optimizations to simplify the technological headaches of the past, data analytics are no exception.
New generation embedded analytics tools solved the problem that big data failed to address for the past two decades. Instead of filing a request to an IT or developer team to generate reports, busy executives can generate a PDF within seconds from anywhere in the world.
Mobile data analytics, specifically mobile dashboards, are a desired asset to any firm with data-driven decision-makers. Here are some of the benefits mobile dashboards offer:
Benefits of mobile dashboards
For teams looking to improve their data reporting and KPI tracking versatility, mobile dashboards are no longer a luxury, but a necessity. Here are some of the many benefits that mobile dashboards can unlock:
- Easier access to real-time insights
Traditional data requires users to connect to a wired network at a specific location, such as a company's headquarters. Mobile embedded analytics eliminate these restrictions, opening the door for use cases that would otherwise be impossible. For example, retail managers can view stock in real-time and submit requests for specific products to improve customer satisfaction.
- Increased sharing capabilities
Wireless sharing capabilities on mobile devices allow for unprecedented levels of data sharing. Department leaders can now share insights across departments and teams to convey concerns. This leads to more informed and unified efforts across all teams.
- Collaboration capabilities
New generation mobile analytics allow for annotations thanks to cloud-based technology. Now, users can highlight any questions directly within a visualization, allowing leaders to answer questions directly within the application.
- Faster decision making
Cloud-based analytics platforms allow decision-makers to diagnose a problem within seconds. Let's use a car manufacturer as an example. A dealership is experiencing a shortage in stock that is in demand by a majority of prospective customers. By using a mobile dashboard to track stock, a manager can instantly call the dealership and make a request to fulfill the necessary parts or automobiles.
Mobile Dashboard Templates
Finance
A mobile finance dashboard is essential for finance leaders looking to keep a constant pulse on the most crucial KPIs. Because mobile dashboards are limited to the size of a device, dashboard builders should prioritize the most important KPIs:
- Revenue
- Current ratio
- Gross profit margin
- Operating margin
By building an uncluttered dashboard of their most important metrics, finance leaders can constantly monitor the financial health of their corporation at their fingertips.
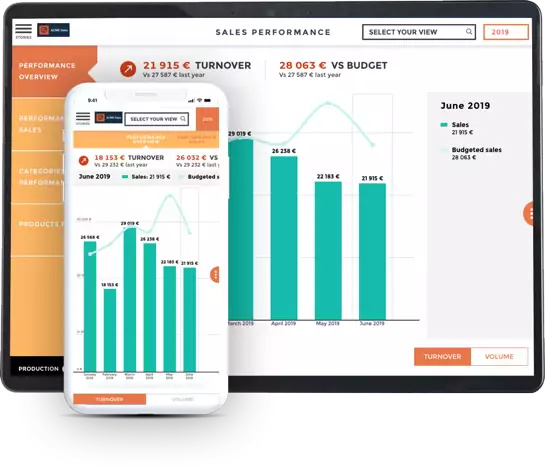
Sales
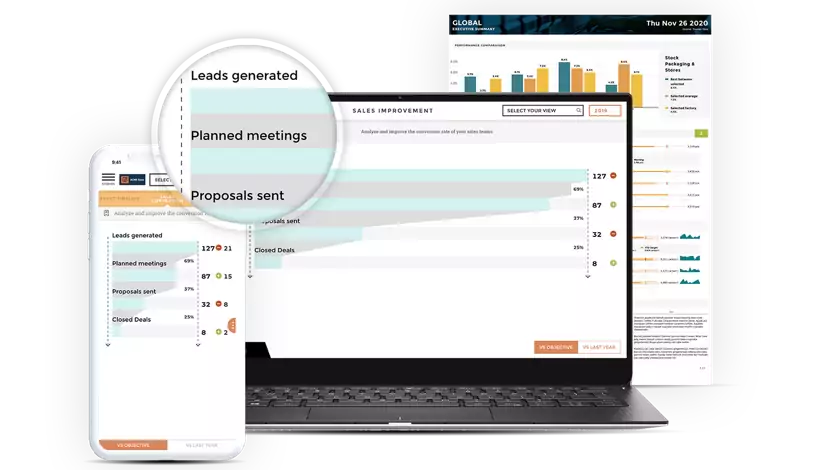
Our next mobile dashboard template focuses on sales professionals, who are reporting a high success rate in mobile analytics adoption. For Salesforce Effectiveness leaders, equipping their teams with mobile analytics ensures that sales representatives can monitor performance, cross-compare between team members, and make data-driven decisions.
Some crucial sales-focused KPIs to include in a mobile sales dashboard include:
- Leads generated
- Monthly sales bookings
- Average new deal size
- Retention and churn rates
By monitoring these KPIs on a mobile device, sales teams on the move are equipped with insights to tweak their target market, improve their processes, and collaborate with team members to achieve improved results.
Marketing
.png?width=500&name=Icones%20lot%203%20(1).png)
Marketing mobile dashboards can offer insights into the details of advertising, SEO, and lead generation for companies in any industry. Here are some KPIs to include:
- Customer acquisition cost
- Marketing qualified leads
- Return on investment
- Organic traffic
Executive
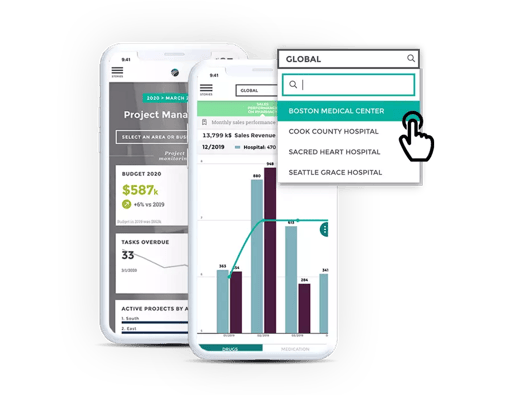
Executives on the go stand to benefit the most from mobile dashboards. As the busiest professionals on the planet, the convenience and portability of mobile analytics help executives view the health of their businesses at their fingertips. These dashboards contain the most important and general metrics to provide a comprehensive overview and usually include these KPIs:
- Revenue growth
- Net Profit
- Employee satisfaction
- Customer satisfaction
Having the ability to view these KPIs anywhere at any time equips executives with a more hands-on approach to operations and promotes communication between the CEO, executives, and every decision-maker.
Mobile Dashboard Best Practices
Although mobile dashboards have the power to elevate a business, the following tips should be followed to create the most effective design:
- Simple is better
Mobile dashboard designers walk a fine line between constructing an effective, yet comprehensive view of a business. The most challenging aspect of mobile dashboard building is a lack of space on devices, especially phones. While it may be tempting to include as much as possible on a mobile dashboard, cramming multiple KPIs and visualizations on a mobile device may be difficult to understand. When designing a mobile dashboard, limit each view to 4-5 KPIs, ensuring that the text is easy to read and provides a clear view to the user.
- Choose charts wisely
As we mentioned, space is everything when creating mobile dashboards. Complex charts may not read the same on a phone screen as they do on a large monitor. Use simpler charts such as pie charts or bar graphs where possible to save space and increase readability. Using a legend and pop-ups may also provide the user with needed insights while preserving simplicity.
- Keep a consistent design
Although mobile dashboards provide a different dimension to data tracking and reporting, professionals still use the traditional workstation to drill down specific metrics. It is important to keep a uniform and consistent look across applications to encourage adoption and reduce frustration.
- Focus on the right metrics
Executives and decision-makers who benefit the most from mobile analytics don't need to view every KPI metric. Mobile dashboards serve as a general overview for users, rather than a one-stop-shop for all analytics. Focusing on the most general and crucial KPIs for each use case ensures that the user receives the most important insights. For example, an executive who views their mobile dashboard notices a sharp decline in revenue growth over a month. The executive can then inform the finance department of the concerning trend and ask for a drill-down to further diagnose the problem.
The mobile dashboard solution
Business owners in any industry or company size can introduce data analytics to increase efficiency in all departments. Whether in sales, marketing, or finance, budgetary constraints play a major role in a business's operations. Tracking metrics for every department at any time and any place can be the difference between a proactive and reactive approach. Mobile data visualization tools provide the best possible solution for tracking these figures and updating KPIs in real-time.
Toucan’s mobile analytics works to cater to specific use cases for several industries, carefully tailoring its applications to the requests and needs of a client. With rapid app deployment, Toucan’s real-time KPI tracking is extremely useful for businesses looking to keep constant tabs on financial health. Mobile optimization also caters to business owners on the move and simplifies complex data sets to tell a firm’s data story.
Design is key, and Toucan approaches each mobile application build with the understanding that without readability, analytics become redundant and frustrating. Applications are optimized to run smoothly on mobile devices and designed with a focus on uniformity. Users can collaborate directly on the application, generate reports, and include legends for a deeper understanding of technical language and reduced clutter.
Mobile analytics will only grow in the coming years as more executives hop on the train, don't miss the chance to gain the competitive edge early.
.jpg?width=112&height=112&name=PORTRAIT_Baptiste%20(1).jpg)
