


How to manage a successful data project?
.png?width=88&height=88&name=portrait_agathe_face%20(1).png)
Agathe Huez
Publié le 16.03.20
Mis à jour le 13.01.26
5 min

Are you in charge of building and automating dashboard projects within your company or a game-changer that brings data focus to the table at work?
Then the next 5 minutes of reading is going to be your best investment of the day.
First let me introduce myself: my name is @Lucie Schweizer as a Delivery Manager at Toucan Toco, and managing data projects is my everyday job.
I wrote this article so you :
- could save thousands of hours, by managing transparently your data projects.
- allow you to spend some time on what matters: your dashboard quality, usage, stability & scalability!
First things first: “User needs stories”… 📝
When we manage a dashboard project and create a small app of Data Visualization for our clients, we sequence our work on several sprints, according to a very simple cycle.
Then, we focus on Design.
Based on the KPIs and on the Key Success Factors of the projects, we build the User stories. Yes, you’ve read well “User Stories”, because there is one common point of all good dashboard projects: they tell us stories, and everybody loves stories, yay!
That’s specifically what makes the success of your DataViz tool. And at the end unites people (your users in fact). Even Tyrion says it.

These User stories precisely, defined with the business-users themselves, reflect how we answer their business questions: visually ⭐️
User stories are the best way to look at business KPIs within a chart. It is the most effective way to understand a business issue, and thus, to make the best decision based on trustful data.
The Design First approach method is key to ensure the success of the project because it includes the understanding of the business unit and the user experience.
Indeed, the end-users can immediately see :
- If the application meets their business expectations.
- What can be done with it.
- What decisions they can take based on the data they’ll see in the stories.
And that’s striking! 🚀
In short, design and fake data as a required 1st step towards adoption and usage.
When a design is validated by end-users, there comes to the best part: data integration!
Here again, we have a very solid method to get the data we want to show in the app and I’m glad to share with you our marvelous approach!
Trust me, your data-life will never be the same after reading that piece.
So, don’t be afraid to dine with the devil 😈
First, we put the data on the agenda at the earliest stages of the project. By the way, even before the project is sold, we make sure the data will be available. We ask our clients to provide data extracts, and we size the project according to the volume/complexity of the data.
This step is key: it makes our clients dig into their own data system, ask for help from the data owners of their company.
Consequently, this allows us to onboard the data experts at the very beginning of the project. That phrase has obviously a huge advantage: they can challenge us by estimating the feasibility of what we’re asking for.
By feasibility, I mean :
- Is the data owned by the company? Is the data available in a system? How can we connect to it?
- Do they have all the data we need to make the calculation we’re asking for?
- Is the data updated as frequently as we need?
Several questions are important to answer 🙂
Once all data characteristics are clear and the app design is validated by the end-users, we have everything in hand to move forward. Yay!
Our goal is clear: sum-up in a very simple way the necessary data specifications to feed the application.
How do we do it? Good question. 👍
We give our clients a very clean, simple, and easy to understand data model which contains two things.
- An exhaustive summary, teasing its content with words.
- And the precious data formatting best practices, that our client will follow when formatting their tables.

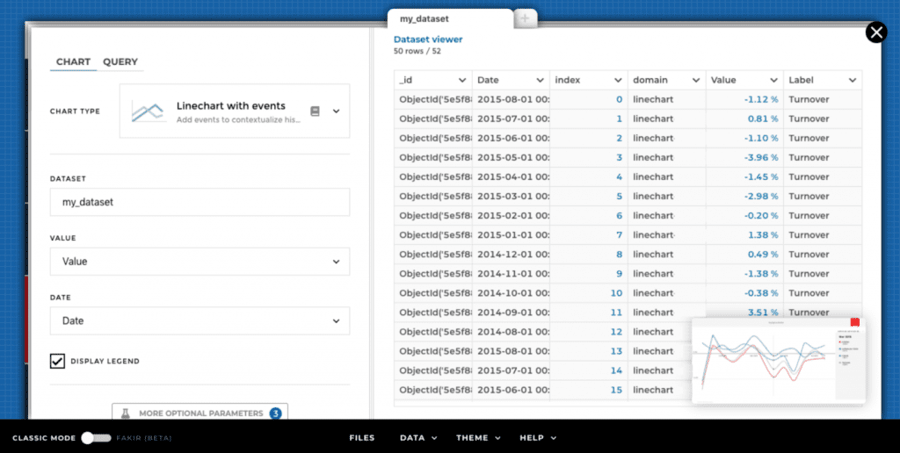
Example of a data model. See! Just a flat-file 😉
By providing data extracts fitting the format we ask for in the data model, our clients ensure that the app will run and grow well. It ensures :
- Stability: Their dashboard will have a long-lasting life, by using KPIs that have been used on their daily missions.
- Scalability: The life of their dashboard will probably be hectic, and still it will be able to adapt to any upcoming changes.
And because we like to share, we’ve written down all this data-model knowledge in pedagogical and very simple documentation: Check this out here.
And… tada! You get a stable & scalable dashboard 💫

Talking by experience, I can tell how painful it can be for you to try to implement a new dashboard tool, and to face a never-ending project.
Plus, when you realize on-the-go you actually don’t know your data, your 2 months project ends up in 2 years one, it’s very disappointing.
So, please follow these steps and prevent this from happening!
Step 1: Prepare your data to get a stable dashboard
“What should I do?” you say. Once the usage of your dashboard has been validated by end-users, simply get in touch with the data owners, and ask them – kindly 🙂 – to fill the provided data model with your business data.
And, using it will have multiple advantages!
- Peace of mind – You’re 100% clear about what’s going to be shown in your dashboard. The KPIs definition and calculation rules, data update frequencies, everything is written down. And more than providing technical documentation, it allows you to explain to the future users why they can make their decisions based on these figures. It allows you to be pedagogical, convince the reluctant ones, and lead to better adoption.
- Business value – You go through smooth data integration and allocate your time to what really matters: the dashboard users. As everything is already aggregated, the format of the data fits exactly what’s expected by the dashboard tool. As a result, you get your dashboard in no time at all, and can quickly validate the accuracy of the data and allocate the time you’ve saved to prepare its deployment to your valued end users! They’ll be delighted to see the correct figures and use this trustworthy new dashboard.

As it’s a 100% win-win operation: take actions with it, gain in productivity, and get your ROI!
Step 2: Own your data and enable your data-driven project scalability
After documented data preparation, you should be ready to face any changes and ensure a dynamic/ evolutive dashboard. Why? Well, the first version has seduced everyone, obviously, people are now hungry for more! 😋 So:
- WTFM (Write The F*cking Manual) – Lead the documentation process and impulse data ownership! Every step of data manipulation must be written down by those who made it. This way, the Data Owner takes responsibility and is an accountant for the data work. This person will be a key to the success of your dashboard project, so are the other member of your A-team. Got it? Great.
- Wind of change – Own your data and anticipate evolution!
With a Data Owner documenting clearly the data prep, you will prevent getting a black-box on your data treatment and be able to rework your dashboard anytime. When you update your metrics calculation, it will be quick and clean. Painless. Because you know what’s behind!
Enjoy reading our dashboard project management guide? Please like this post and share your best practices with us in the comments! And always keep in mind that even if data work can be challenging, it is worth it! It brings scalability to a project, this is clearly priceless 👑
Interested in building your own data model? Leave your email address in the comments, and we’ll send you our data model example for free – no worries about data accuracy, these are all fake 😉
And as sharing is caring, find below the links to my amazing references :
Speak to you soon!
.png?width=112&height=112&name=portrait_agathe_face%20(1).png)
