


The Most Important KPIs to Track for Improved Marketing Efficiency
.jpg?width=88&height=88&name=PORTRAIT_Baptiste%20(1).jpg)
Baptiste Jourdan
Publié le 26.03.19
Mis à jour le 13.01.26
6 min

What are Key Performance Indicators (KPIs)?
KPIs (Key Performance Indicators) are quantifiable measures used to evaluate, in this context, the performance of marketing campaigns. They are valuable resources to help marketers make informed decisions and validate returns on marketing spend.
Measuring marketing KPIs is fundamental in readjusting a business user's strategy. Measuring the right marketing KPIs allows one to evaluate the effectiveness of your marketing efforts whilst enforcing your strategy over the long term.
How DO YOU SELECT marketing KPIs that matter?
It is essential to choose efficient marketing KPIs in accordance with your business needs. Tracking the wrong, or irrelevant, KPIs won’t drive actionable results and will likely just waste time..
In order to choose efficient marketing KPIs, it can be helpful to ask yourself the following questions:
- What is the core business of my company?
- What are the most important results support our growth objectives?
- Do I want to sell more merchandise to generate leads or to generate subscriptions?
There are obviously loads of questions that you can ask yourself, and context is going to dictate what those will be.
In this article, we have decided to focus on KPIs that impact any successful online marketing strategy.
The 10 Most Important online marketing KPIs you should be tracking
- ROMI (Return on Marketing Investment)
The purpose of measuring ROMI is to help you evaluate if your marketing expenses are actually contributing to profit. If you have a positive marketing return on investment, it means that your campaigns are generating a net profit over expenses.
Knowing the ROMI of your campaigns also helps you to better understand where you can allocate your marketing budget for the best results. For example, if one of your campaigns generates a 15% return on marketing investment while another generates 70%, you're left with a strong sense of where marketing dollars are best spent.
Measuring ROMI
- Short-term ROMI
Short-term ROMI is calculated by comparing revenue profits against marketing investment. While this calculation only accounts for the direct impact of marketing investments on a company’s revenues, it is still relevant. - Long-term ROMI
Long-term ROMI can be used to determine other, less tangible, aspects of marketing effectiveness. For example, if a marketing campaign does not generate a lot of sales, but increases traction across social channels, is it still considered a failure? It is relevant to consider measures such as brand awareness in ROMI indicators in order to quantify less tangible benefits and target future campaigns more effectively. Understanding and defining your success criteria is therefore important.
- Lead conversion rate
The lead conversion rate represents the percentage of individuals or businesses that were converted into opportunities after expressing interest in a product or service. Tracking your conversion rate is essential to better understand your sales funnel and what marketing campaign(s) has the greatest impact on your company’s ROI.
Calculating Lead Conversion Rate
To calculate the lead conversion rate, divide the number of leads converted to opportunities in a given time period by the number of leads created in this same period. Then simply multiply the result by 100.
Lead conversion rate = (The number of leads converted in a specific time period / the number of leads created in this same period) x 100
For example, if 100 leads were created in January, and 25 leads converted to opportunities in this time period, then your lead conversion rate would be 25%.
- Conversion rate by marketing channel
In order to maximize your lead conversion rate, it is essential to identify which marketing channels generate the most qualified leads. Sales prospecting? Emailing? Events? Inbound? Calculating the average conversion rate for each of these channels is another action you can take to prioritize and improve those which bring fewer opportunities.
- Cost per lead
Cost per lead is the cost you pay to acquire a prospect through a given marketing channel. Tracking your cost per lead allows you to make more strategic marketing decisions: this metrics will help you evaluate the effectiveness of your actions and keep control over your channel-by-channel budget.
Calculating cost per lead
To calculate your cost per lead, divide your cost for each lead generation campaign by the total number of leads generated by that campaign.
Cost per lead = The cost for each lead generation / The total number of leads generated on that campaign
- Customer Lifetime Value (CLV)
Customer Lifetime Value is a prediction of the profits generated by a company throughout its relationship with each of your customers. Increasing the Customer Lifetime Value allows you to maintain a relationship with your customers, reduce the rate of disengagement, and improve their satisfaction. It also helps you to estimate a reasonable cost per acquisition.
Calculating Customer Lifetime Value
There are several different ways to calculate CLV. Each business is likely to adopt different variables for this calculation that relate to their objectives or target segmentation. However, the most straightforward way to calculate CLV is to subtract the initial cost of acquiring each customer from the revenue earned from that customer.
Customer Lifetime Value = The initial cost to acquire a customer – The revenue earned from a customer
- Organic traffic and SEA traffic
Organic traffic refers to the traffic on your website generated by free search engines such as Google, Bing, or Yahoo. It is a valuable resource that usually represents more than half of your website’s total traffic.

SEA refers to the traffic generated by paid marketing, thanks to pay-per-click ads. SEA is a great tool because it unlocks complete control over your online campaign and increases traffic. However, the disadvantage of SEA is the monetary cost (though success often outweighs cost and is an important component of a successful demand generation engine).
Calculating Organic Traffic and SEA
Organic traffic and SEA traffic can be measured by CMS integrated analytics tools, Google Analytics, or with a data visualization reporting tool, to better cross-reference with other data that matters.
- Website Traffic to Marketing Leads
Website traffic is an essential metric, but by itself, it can be misleading! For example, if your pages generate high traffic, but aren’t converting visitors into leads, consider rethinking your strategy.
The key is to contrast your website traffic with other measures. By contrasting website traffic to marketing leads, for example, you could evaluate the efficiency of your marketing actions and their impact on your company’s ROI.
Calculating Conversion from Website Traffic to Marketing Leads
The ratio of website traffic to marketing leads is the percentage of visitors who turned into leads. To measure this KPI, divide the number of unique visits by the number of leads generated over the same time period. For example, if you have 1,000 website visitors in January and 100 new leads in this time frame, your website traffic to lead ratio is 10%.
Website Traffic to Marketing Leads = the number of unique visits on a specific time period / the number of leads generated over the same time period.
- Social media ROI
Tracking social media ROI is fundamental to an evaluation of online marketing strategy performance. All your social media efforts should be trackable so you’re never scrambling to prove the value of a campaign. Regarding website traffic data, social media reach must be taken in context with its impact on conversion rates and ROI. This way, there is a higher chance of achieving an optimal marketing strategy that goes beyond a notoriety objective.
Calculating Social Media Reach to Conversion Rates
To calculate social media ROI, divide the revenue of each channel by expenditures. Using a data visualization reporting tool helps to cross-reference this KPI with other data.
Social media reach to conversion rates = The revenue generated from each channel / The expenditures made for each channel
- Email marketing open rate and click-through rate

Another impactful bucket of marketing KPIs are those (and there are a lot!) that serve to evaluate email marketing campaign performances. Some of these measures include:
Calculating Open and Click-Through Rates
- Email open rate
An email open rate is the percentage of people who opened an email campaign. This measure allows you to evaluate the relevance of your email subject lines and helps to uncover the quality and engagement of your mailing list.
To calculate the email open rate percentage, divide the number of opened emails by the number of emails delivered and multiply this figure by 100.
For example, if you deliver an email to 100 contacts, and it is open by 50 of them, your email open rate will be 50%
Email open rate = (The number of opened emails / The number of emails delivered) x 100
- Click-through rate
The click-through rate (CTR) is the percentage of people who clicked on a link within an email. This measure evaluates call-to-action efficiency. To calculate your mailing campaign click-through rate, divide the number of clicks on a link by the number of emails delivered and multiply by 100.
For example, if you send a message to 100 contacts and 20 of them click on a link in the email, your click-through rate is 20%.
Click-through rate = (the number of click on a link / the number of emails delivered) x 100
- Click-to-open rate (CTOR)
The click-to-open rate (CTOR) is a complementary measure to the click-through rate. The CTOR also corresponds to the ratio of emails in which the user clicked on a link, contrasted with the number of unique opens. This measure allows you to evaluate the effectiveness of your email’s content!
Calculating CTOR
This metric is calculated by the number of unique clicks divided by the number of unique opens multiply by 100. A good CTOR will vary between 20 – 30%.
Click-to-open rate (CTOR) = The number of unique clicks / The number of unique opens x 100
How DO YOU Track ALL OF YOUR marketing KPIs without feeling overwhelmed?

Amongst the greatest difficulties for a marketer is to track these marketing KPIs, through different tools, to be able to cross-reference and analyze them. This exercise is extremely time-consuming and requires robust knowledge of crucial measurements…
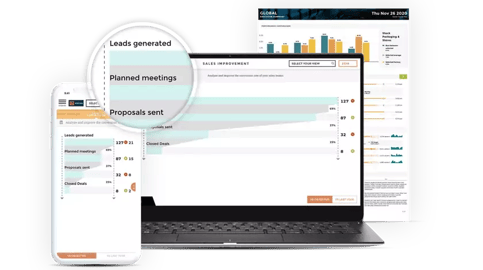
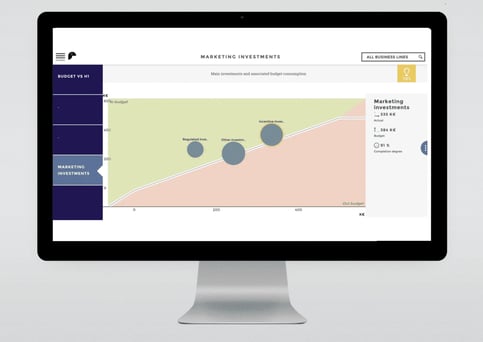
This is where data visualization reporting tools are very useful! These software solutions offer reporting and cross-reference analyses in unique and intuitive dashboards.
Here at Toucan, our small apps are mobile, easy to use, made for action, and easy to set up in any information system. Join us on our mission of creating Business Performance Stories through Guided Analytics!
.jpg?width=112&height=112&name=PORTRAIT_Baptiste%20(1).jpg)
