


Guide to Building an Efficient Analytics Dashboard
.png?width=88&height=88&name=portrait_agathe_face%20(1).png)
Agathe Huez
Publié le 22.08.17
Mis à jour le 13.01.26
6 min
Let's start things off with some good news. Today, you don't need a team of IT pros or qualified graphic designers to create a dashboard. That's true regardless of your use-case for an analytics solution - it's possible for anyone, regardless of their technical literacy or analytics experience, to build a stellar analytics solution.
But, once you've collected, cleaned, and consolidated your data, and have created the optimal mix of useful metrics, your work isn't (quite) done.
That's because if you don't think strategically about dashboard design principles and data storytelling best practices, your analytics won't actually get used. That's why, in this article, we want to walk you through 10 simple steps that can help you on your journey to become more (successfully) data-driven.
...and if you want to dive deeper, check this out:
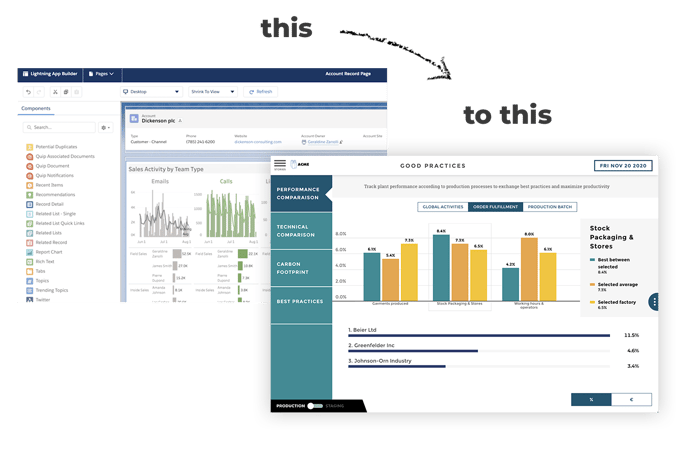
So, What is a dashboard?
It follows that if we want to create a dashboard, we should make sure we're aligned on what a dashboard actually is.
Analytics dashboards are used, whether for Business Intelligence experts or everyday business users, to visualize raw data and make it more accessible and comprehensive. In order to make data easier to read, dashboards use different visual tools that allow for a simpler and more creative presentation of the metrics that those concerned care the most about.
Dashboards are practical for a variety of reasons, not the least of which might include analyzing data in real-time, historically based on different contexts and analyses, or anything in between. Ultimately, they're used to drive effective, data-driven decision-making regardless of what you're using them for.
The rapid and continual evolutions in technology have changed the ways in which data is collected, and the volume of it that's produced. The result? Companies are getting lost in their data, storing thousands of terabytes of useless data for analysts to plow through. So, while spending on analytics has actually exploded, users aren't getting value from it.
That's why dashboards are increasingly fundamental as they provide much-needed simplification and accessibility. For everyone. Visual representation using graphs and charts offers an experience that simply can’t be created otherwise.
This brings us to the question:
"How do I build a dashboard that will benefit my business?"
There's no one-size-fits-all dashboard approach, but anyone can come to an answer that they're satisfied with. So...
What methods should be used to create a dashboard?
- The Basics
A dashboard is one single screen made up of the indicators that are most relevant for a given team and/or company.
Therefore, a dashboard should:
- Not be cluttered, showing all data points (including those that are irrelevant)
- Cover essential information
- Be a selection of the most relevant indicators of your use-case
When looking at your dashboard, the first thing you should see is therefore a quick, visually digestible display of the data that's most important to those who are looking at it.
Excel tabs, secondary menus, and the like that are created with data visualization tools will help you dive deeper into your data.
- Address A Relevant Weakness/Need
You must start by identifying your operational needs, then understanding your audience. You have to ask yourself: which data best addresses the specific questions of interest? As organizations and professional fields are very diverse, the way the dashboard is configured will have to accommodate their different needs and backgrounds.
Create a screen or a tab for each data query. Too often dashboards are full of irrelevant data. The problem with these dashboards is that they do not portray a clear message. Your user doesn’t need to see all of the data which are available. They only need to see the information that they can use for their tasks. Therefore it is your job to organize the data for them.
In order to do this, you must know what the board and your colleagues expect to see.
Useful tip: a huge amount of public data is available on Office for National Statistics and on other public databases. With this data, you can give your audience the big picture.
- Creating Action Points
Building a dashboard is a process that evolves constantly, demanding constant focus and attention. Your projects will evolve, and so will your company. An effective dashboard is one that you can revise later if necessary. Meet with colleagues regularly and review the objectives to make sure the selection of indicators still meets their needs.
Each indicator must represent an action for its users.
- For example, a declining number of visitors to a website can alert the marketing department to take immediate action.
- The data must generate action, but the data can signal an anomaly.
- Accounting for anomalies and outliers is an important criterion that needs to be built into a dashboard to prevent the excessive expenditure of resources.
- Defining Performance Indicators
The wrong choice of indicators is a point of no return for any organization. Each indicator must serve the company’s global strategy. Furthermore, it should be clear what actions are required if there is a sudden change in the data.
If you choose the wrong indicator for your dashboard, you risk that your team loses focus and undertakes the wrong course of action. For an indicator to be on your dashboard, it needs to be:
- Comprehensible
- Adapted to those with access
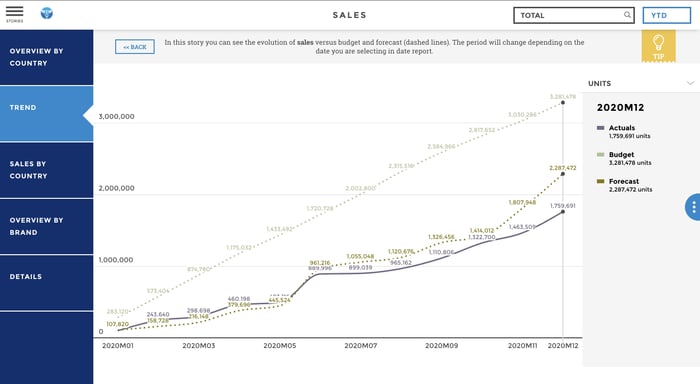
- Reliable and comparable contextually
For example, it wouldn’t make sense to give the company’s annual revenue without first comparing it to the previous years’ revenues or to another company’s revenues.
It is necessary to keep this logic with respect to the audience and for all indicators.
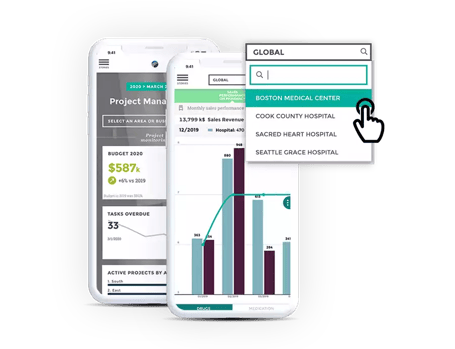
- Creating a Mobile Dashboard
How does your audience use information? Most users like to use their computers to look at reports. However, some users might find a mobile profile more useful. For example, managers and salesmen are users who are always on the go. Therefore it is important for them to be able to access the dashboard freely on a mobile device.
Since dashboards are interactive tools, mobile compatibility allows the user to interact with the data at his fingertips. You can touch your creations to show more detail, navigate through the main menu into different subcategories. Most importantly, you can give a live demo when making a presentation to clients.
How to tell a story with your dashboard
Our brains are comprised of three parts. When we listen to a story or experience an event, the same part of our brain is stimulated. The neocortex links the reasoning to the emotion. Our decisions are therefore influenced by our emotions.
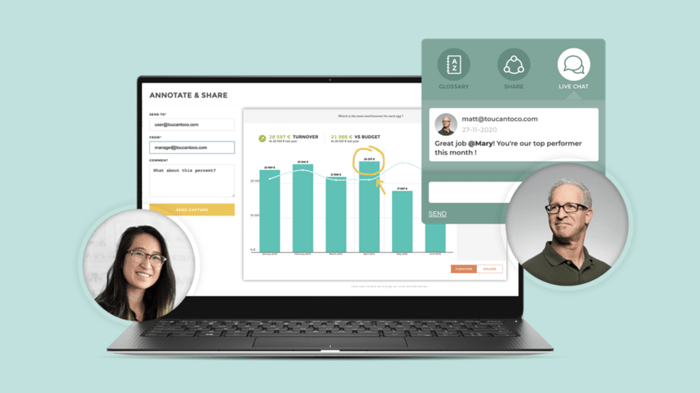
The challenge is to create a dashboard that is clear, has an impact, and touches on the reader’s emotions!
The world's best speakers always talk about their past experiences and feelings when they want to present a fact or a statistic. During your presentation, don’t forget to give context to what you are presenting, it will help you keep your audience focused on what you are saying. Give your data a human touch.
How can you incorporate these concepts with numerical data?
- Making your Data More Familiar
If your audience is knowledgeable about the data that you are presenting, they will be more receptive to the message you are trying to relay.
It is your job to find the best examples that relate to your audience. Try new things, show not only your data but also why you are showing it. Give context and illustrate your data with stories and experiences.
- Making it Easy to Read
Are you tired of not understanding someone else’s dashboard? Don’t make the same mistakes.
The easier the data is to read, the quicker it will be understood. Decision-making is also affected by the clearness of your dashboard. If it is clear to the reader, he can take instantaneous decisions on the outcome. Something to keep in mind is that the user isn’t always familiar with the data format. Therefore it is very important to give accessible information to the users.
A graph must convey a single message. Often, dashboards present dozens of indicators and graphs which result in the loss of the users’ interest. Do not overwhelm the audience by presenting graph after graph of information. Present only one idea or visualization per screen. You can use many slides if you have a lot of things to the present.
- Plotting the Data
To captivate your audience, narrate a story.
Data is used to add truth to what you are saying. It shouldn’t be the center of your arguments. To tell a story, you must contextualize your data. Write a story that revolves around your data.
Work on making your dashboard more colorful. Your comments and titles should be easy to read. This allows your audience to follow and anticipate the data that is being presented.
- Understanding your Audience
When you are preparing your data analysis report, it is essential to answer the right questions. To do this you must put yourself in the shoes of your audience.
You have to ask yourself, "Do the reporting tools that I am using correspond to the message I want to convey?" Is the graph I am using intuitive enough for my audience? Is this indicator comprehensive enough?
- Presenting it Smoothly
Fear of data and statistics is often an obstacle for the audience in understanding a report. You can overcome this by visualizing the data. At times, the audience needs you to guide them. The situation is to demonstrate and use data storytelling.
We hope this article helps you to understand how to build more effective dashboards. Ones that are simultaneously jaw-dropping yet balanced, in-depth but straightforward, accessible, and tailored to your goals and to the needs of your users.
At Toucan, we believe that powerful analytics don't have to be complex and frustrating. That's why we've made our mission, creating amazing Guided Analytics for Business users, all about making it easy to connect to any data and deliver insights to everyone in minutes - no Ph.D. required.
.png?width=112&height=112&name=portrait_agathe_face%20(1).png)
