


Building a dashboard for workforce management
.png?width=88&height=88&name=portrait_agathe_face%20(1).png)
Agathe Huez
Publié le 20.08.19
Mis à jour le 13.01.26
2 min
Tracking the evolution and distribution of a company’s workforce in order to predict outgoing and incoming flows is a key issue for HR departments. Large organizations must grapple with the complexity inherent to their size.

In a large group, managing employees through HR dashboards can sometimes be difficult given the various business units, subsidiaries, and countries that must be taken into account.
workforce management dashboard
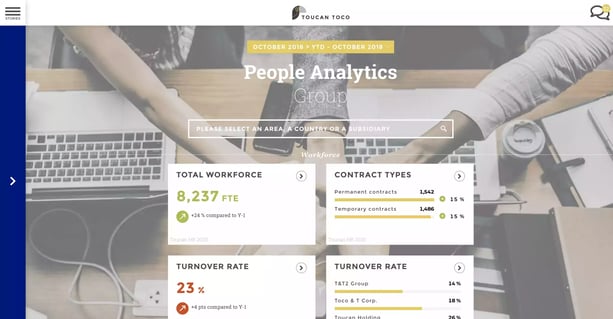
To facilitate day-to-day decision-making, many information systems assimilate and store data. Dataviz builds on these systems to cover the last mile up to the end-user.
Here’s the example of an interactive screen that provides a complete understanding of a department’s activity. This visualization offers the possibility of managing the workforce by acting on three variables. To learn more about other specific user cases, we also wrote an article on recruitment issues.
TIME VARIABLE IN WORKFORCE MANAGEMENT
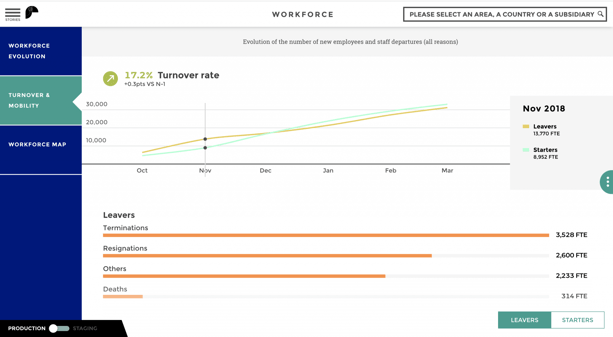
The dashboard provides perspective on the whole year as well as a monthly overview of the workforce. The purpose of this graph is to combine an aggregated as well as a very granular and detailed view. At a glance, the user can see that the number of hirings has been growing since October.
With this information, they’re able to measure the impact of their recruitment strategy or, on the contrary, discern an anomaly.
SET UP YOUR REPORTING ACCORDING TO EVERY DEPARTMENT
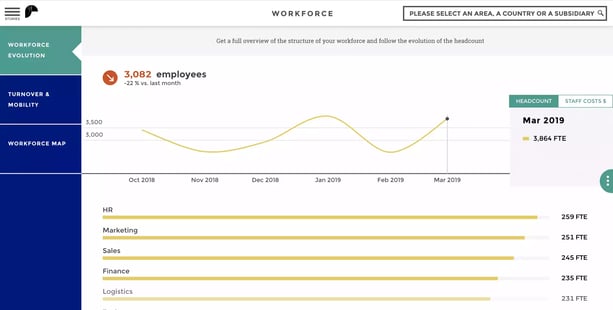
This overview is automatically listed by the number of employees. It helps detect the departments that have the largest staff and how they are changing year over year. As the year changes, the ranking is automatically updated and depicts the evolution of employees by department. This contributes to comprehensive workforce management.
workforce management: TAILOR THE DASHBOARD TO YOUR EMPLOYEES
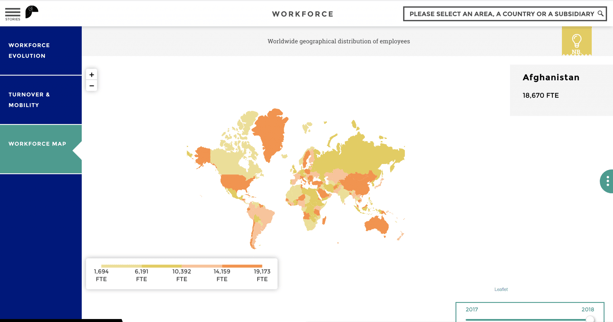
This last filter allows you to segment your employees into several categories, with the ability to zoom in on any relevant staff member. Organizations can go even further and filter according to specific business units.
This dashboard helps understand the status of each department and compare them with one another, over time, and by type of employee. By analyzing fluctuations, human resources directors and managers can make more informed decisions and predict future needs in a specific department or business unit.
Do you want to learn more? Come and discuss this matter with our team dedicated to HR topics!
Find out more about Nexity‘s experience, a company that has opted for a data storytelling tool to address its HR issues.
—
At Toucan, we believe that the latter is the true way forward. This calls for companies to –
- Be ready for self-funded transformation projects that are easy to action.
- Start automating wherever and whenever you can.
- Finally, and most importantly, plow data for insights and decision-making.
This spirit of innovation, aspiration, and an unwavering commitment to tech-led value addition, is the real way out. In many ways, it will help businesses weather the storm and prepare for a post-COVID-19 world.
Stay safe, and stay connected.
.png?width=112&height=112&name=portrait_agathe_face%20(1).png)
