


How to Design Impactful Customer-facing Insurance Dashboards
.png?width=88&height=88&name=portrait_agathe_face%20(1).png)
Agathe Huez
Publié le 17.02.23
Mis à jour le 13.01.26
8 min
In today's forward-thinking insurance companies, innovative, interactive, data-driven dashboard tools have made it easy and swift to create effective customer experience dashboards. In the digital age, there’s no need for a department of IT technicians, plus a qualified graphic designer, to create a dazzling data dashboard. You can do it all by yourself with low-code embedded analytics solutions like Toucan. It is essential, however, to acquire a firm grasp of logical judgment and strategic thinking - especially with respect to insurance dashboard design principles, in order to achieve optimal success.
In order to create an exceptional customer experience in insurance, you should already have completed the major part of the work needed - collecting data, cleaning it, combining different data sources, and creating an array of useful metrics. Now comes the fun part. Designing your customer-facing insurance dashboard.
You may want to let your creativity run wild and design an attractive, dazzling, colorful dashboard. Unfortunately, you cannot play around with designs like the next Michelangelo. Dashboard design best practices can help you display your data in the best way possible, making it easy for your customers to analyze and act on.

Your custom-facing insurance dashboard should be user-friendly and drive the data-driven decision-making process. In this article, we will discuss 11 insurance dashboard design principles you can use to design a dashboard tailored to your needs.
Let's take a closer look at what the insurance dashboard design process entails.
How To Design an insurance Dashboard to enhance customer experience
To create striking, results-driven data dashboards on a sustainable basis, you need to master the 11 definitive insurance dashboard design best practices.
The best customer insurance dashboards are clear, interactive, and easy to use. A customer-facing embedded analysis tool should be able to communicate information at a glance using efficient data visualizations to enable users to discover actionable insights, identify trends and patterns, and make data-driven decisions. To achieve an effective dashboard design UX, the most relevant data must be used, usability should be prioritized, and core business objectives must be considered.
In order for insurance dashboard design principles to be effective, they need to be integrated into a structured process. To make sure you don't miss any essential steps, let's go over the customer-facing insurance dashboard design guidelines.
1. White label and embedded analytics
The ability to white label and embed dashboards into your own applications is a critical consideration when designing a modern insurance dashboard. The dashboard can be completely customized with your company's logo, color style, and overall brand visual identity elements, so you can make it your own.
Embedded dashboards with white labels look like your own products, so you don't need to invest in development. Simply partner with an existing customer-facing product made for insurance companies, like Toucan. With embedded analytics, data manipulation and analytical processes are completely integrated into our existing systems and applications without requiring technical expertise. Most customers prefer this option so when you consider what kind of dashboard features you want to implement in your design, embedding and white labeling are the 2 most important options you need to take into account.
2. Consider your audience
One of the most important considerations when designing your insurance dashboard is your audience (aka your customers). In order to create the most useful analytical tool for your users, you must know who will use the dashboard and for what purpose they will use it. It is essential that you place yourself in the customer's shoes in order to do so successfully. Depending on the context and device on which customers access their dashboards regularly, the style of information displayed will vary.
A further consideration is that if you make the charts appear too complex, your customer will spend a greater amount of time analyzing the data than they would have without the insurance dashboard. Dashboards should provide additional value by displaying data analysis. However, you should never lose sight of the purpose of creating a dashboard. The purpose of presenting data in this manner is to facilitate the decision-making process for a specific audience by presenting it in a clear and understandable manner.
- What data will your customer be looking for?
- What information would help them to better understand the current situation?
- How can you depict metrics clearer to provide more actionable insights?
- Do the users need comparisons with previous periods?
These are a few questions you could ask your customers to better understand your audience and their requirements.
3. Determine your goals
The next insurance dashboard design principle has a direct relationship between your customer's needs and the purpose of the dashboard, which is to establish the ultimate goals. Every customer dashboard you create will serve a purpose and answer key questions through the data. It is important to consider that not all the data available will be useful for the analysis process and that getting this part of the process wrong can render your further efforts meaningless.
To determine the right goals, you need to carefully consider what metrics and data sets will bring value to your insurance dashboard. Answering questions like
- What exactly needs to be measured?
- Who will measure it?
- What is the time interval to be measured?
Once you have a clear understanding of the main goal of your reporting it will be much easier to pick the right insurance KPIs.
4. Choose relevant KPIs
It is essential that you select the right key performance indicators (KPIs) for your business needs in order to create an effective customer-facing insurance dashboard. You will be able to select the best KPIs for your dashboard once you have determined your ultimate goals and taken into consideration your customers.
Insurance key performance indicators will assist in shaping the direction of your dashboards as these metrics will provide visual representations of relevant insights specific to specific areas of the business.
To help you with your decision, we have selected the most important insurance KPIs to monitor to boost transparency.
5. Tell a story with your data
Data storytelling is the presentation of data in a visual manner in order to convey the whole narrative of the data analysis process for the purpose of understanding business strategies and goals. By using efficient storytelling, you will be able to convey your message in the clearest manner possible.
Data stories play a fundamental role in bridging the gap between analytics and business users. As Forbes states in one of their articles: “storytellers use data-driven narratives to enlighten those team members for whom data analysis is unavailable, inaccessible or simply not the best use of their time”.
You can make your insurance dashboard more efficient by designing it beforehand. Your dashboard will be more focused when you plan what charts you will include based on your audience and goals. Using this method, you will not have to mix visualizations and see if they work together. Create reports that are useful to users and consider their level of understanding.
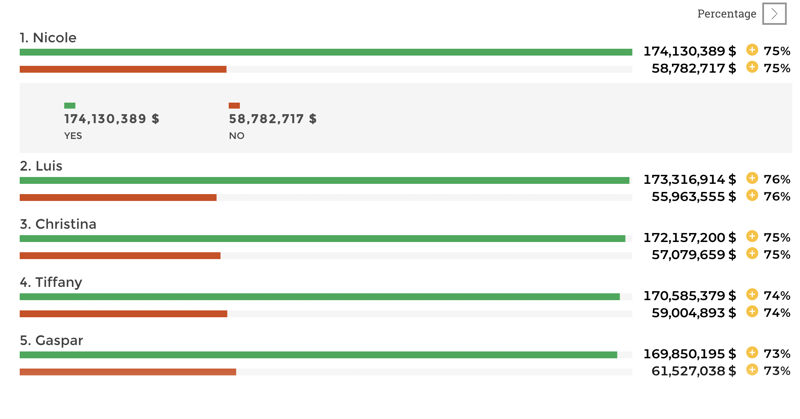
6. Provide context
In the absence of context, how will your customers be able to determine if those numbers are good or bad, or if they are typical or unusual? In the absence of comparison values, the numbers on a customer-facing insurance dashboard are meaningless. Additionally, customers will not be able to determine whether any action should be taken. That is why at Toucan we have added another layer with color-coded metrics. This way customers can look at insurance dashboards and immediately understand if they are performing well or not.
Make sure to provide as much information as possible, even if some of the details seem obvious to you, your audience may find them confusing. You can do this in multiple ways with Toucan as it was built with context at every turn. The glossary provides additional information on all the terminologies used. Tips give more insights in how to use the charts and Filters provide multiple views of the same data. Don't forget to provide comparison values. You should use the most common comparisons here, such as comparing against a target, a previous period, or a projected value. There is a very effective insurance dashboard design tip that you should always keep in mind.
7. Use the right type of chart
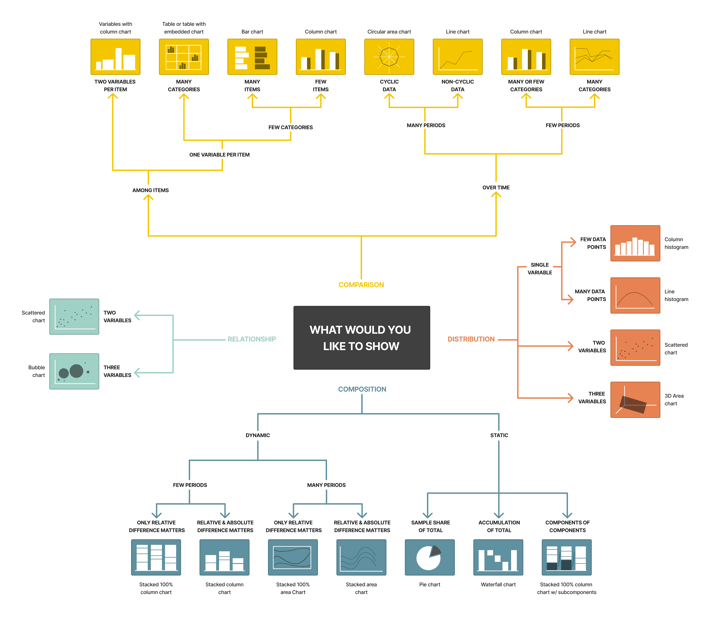
It is imperative to choose the right type of data visualization. A missing or incorrect chart type can ruin all of your efforts. Choosing a data visualization that is appropriate for the task depends on the type of information you wish to convey. Here is a helpful guide to data charting.
A dashboard-centric chart or visualization can be categorized into four primary categories based on its purpose: relationship, distribution, composition, and comparison. Prior to selecting a chart type, you should understand the purpose of the metric. There is a chart type to suit your needs depending on what you wish to communicate or demonstrate. In order to make an informed decision about the chart type, you should place your objectives into one of the four primary categories listed above. The following graphic will serve as a guide to help you choose the right chart type based on what you are trying to illustrate:
8. Prioritize simplicity
One of the best practices for insurance dashboard design focuses on simplicity. Nowadays, we can play with a lot of options in chart creation and it’s tempting to use them all at once. However, try to use those frills sparingly. Frames, backgrounds, effects, gridlines… Yes, these options might be useful sometimes, but only when there is a reason for applying them.
Moreover, be careful with your labels or legend and pay attention to the font, size, and color. It shouldn’t hide your chart, but also be big enough to be readable. Don’t waste space on useless decorations, like for example a lot of pictures. Take the Data-Ink ratio concept introduced by Edward Tufte as a guide. The data-ink ratio is the proportion of ink used to present the relevant data compared to the total amount of ink in the graph. The goal here is to keep the less relevant information (non-data-ink) out of your dashboards as much as possible as they distract from the main intention of the visuals.
Designing a customer-facing insurance dashboard should be a well-thought process but the end user should see a simple data story with the main points highlighted and the points should be immediately clear. If this is not respected, more questions will arise about the dashboard itself rather than discussing the points that you're trying to make and the story you're trying to present.
9. Don’t go over the top with real-time data
Next on our list of good dashboard design tips refers to insight: don’t overuse real-time data. The information displayed in too much detail only serves to lead to distraction. Unless you’re tracking some live results, most dashboards don’t need to be updated continually. Real-time data serves to paint a picture of a general situation or a trend. Most customer-facing insurance dashboards must only be updated periodically – on a weekly, daily, or hourly basis. After all, it is the right data that counts the most.
Moreover, you can implement smart alerts with Toucan so that the insurance dashboard itself notifies you if any business anomalies occur. That way, your refresh interval, and intelligent alarms will work hand-in-hand, making them one of the insurance dashboard design guidelines that will ensure you save countless working hours.
10. Optimize for multiple devices
Customer-facing insurance dashboards should also be optimized for mobile and tablets. Providing remote access to your customers allows them to answer crucial business questions without having to attend office meetings. Everyone will be able to review their insurance data instantly thanks to features like data-driven decision-making and instant insights.
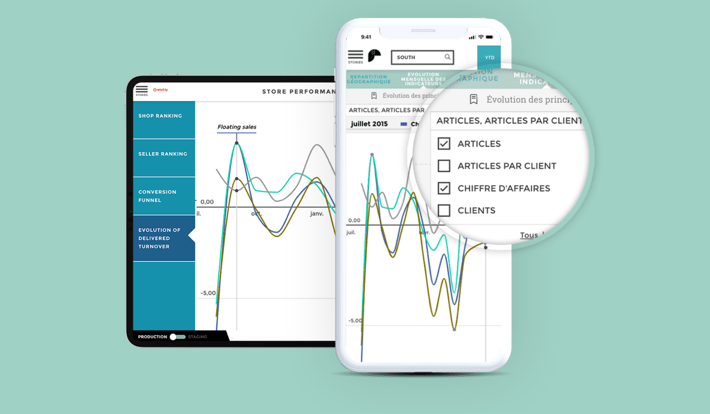
Mobile dashboards have a smaller screen, so the elements are positioned differently. As a result, the level of analysis will not be as deep as on the desktop version, since dashboards have to focus on the most critical visuals, usually at high levels. This would be the case for most solutions on the market, where they make you design a separate dashboard for mobile use. But at Toucan we believe in working efficiently and making analytics as easy as possible for business users. That is why Toucan has the build once, deploy anywhere feature. This means that the charts you build are responsive and adapt to any device from desktop and mobile to tablet and TV screens.
In case you have an analytics solution that makes you build the same dashboard over and over for different devices keep in mind that to create such a design, you should trim all the surplus that is not relevant and test across each device. 'Bigger fingers' should also be considered in the insurance dashboard design process. It should be noted that not everyone has smaller hands, so buttons should be well-optimized for all hand sizes and shapes. Lastly, keep only the most vital metrics and information visible on the screen so that they can be scanned easily.
11. Never stop evolving
Last but certainly not least in our collection of principles for constructing an effective insurance dashboard - being able to tweak and evolve your design in response to changing conditions will ensure continuous analytical success.
You should always ask your customers for feedback when generating reports. You may be able to improve the layout, functionality, look, feel, and balance of KPIs by soliciting regular input from your customers and asking the right questions. In order to remain on the same page with your customer, you should ask for feedback on a regular basis. Keeping your audience in mind is the most important factor, and you must know how to effectively adjust the visuals to achieve your goals.
We live in an ever-evolving digital world. It is imperative to maintain a willingness to improve and enhance your design efforts continually in order to produce an effective customer-facing insurance dashboard. So, never stop evolving.
.png?width=112&height=112&name=portrait_agathe_face%20(1).png)
