Have you ever found yourself staring at a set of numbers and figures within a spreadsheet and found yourself lost? You know that there is valuable information within the data, but, unless you’re intimately familiar with the data itself, it can often be a struggle to turn raw data into meaningful business insights.
That’s where data storytelling can help to turn advanced data analytics into more easily digestible and understandable narratives that allow audiences - even those consisting of unspecialized readers - to access the true value of the data itself.
-1.png?width=857&name=Blog%20Graphics%20(2)-1.png)
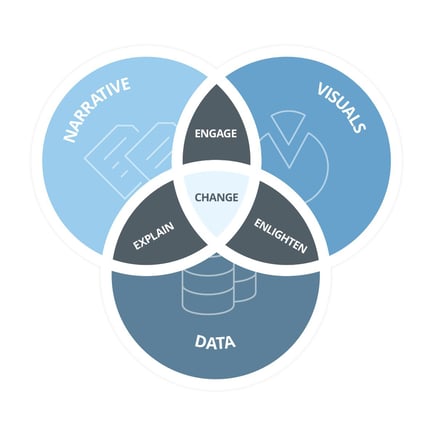
So what is data storytelling?
In its simplest terms, data storytelling is the concept of taking data and turning it into a format that is personalized for its intended audience. For example, whilst they might often rely on some of the same data, your marketing and sales teams will have different reporting needs and a different level of understanding when it comes to certain data analytics and concepts.
Data storytelling is fundamentally a business intelligence movement aimed at democratizing data analytics and delivering them in a clear and pedagogical manner. If you think of it in its simplest terms, improved data visualization can help your teams to extract the business insights that they need from your data analytics as easily as possible.
The data storytelling movement has impacted businesses within virtually every industry. If you’re totally unfamiliar with the concept, Five Thirty Eight has shown how effective storytelling can make data more understandable, relatable, and memorable. When armed with the right tools, any company will be able to turn their complex data analytics into structured data narratives.
According to the Bureau of Labor Statistics, this decade will see the demand for research analytics grow by 25 percent. So even if your company might have access to an increasing amount of data and more advanced data analytics, the question will become less about whether or not you have the data itself and more about if you’re able to present it in the right format.
The impact of good data storytelling
We’ve all had the concept of ‘big’ data drilled into our minds. For many of us, there can never be enough data. But the reality is, it’s about focusing on the data analytics that help you to identify business insights.
What are some real world examples of good data storytelling? The truth is that you don’t have to look that far.
Take something as complex as the COVID-19 pandemic. In a confusing and worrying time, many were overwhelmed by the various numbers, figures, and data that was being thrown at them relating to the outbreak and the spread of the virus. An extremely uneducated audience was being presented with data analytics that were usually only consumed by a highly specialized group.
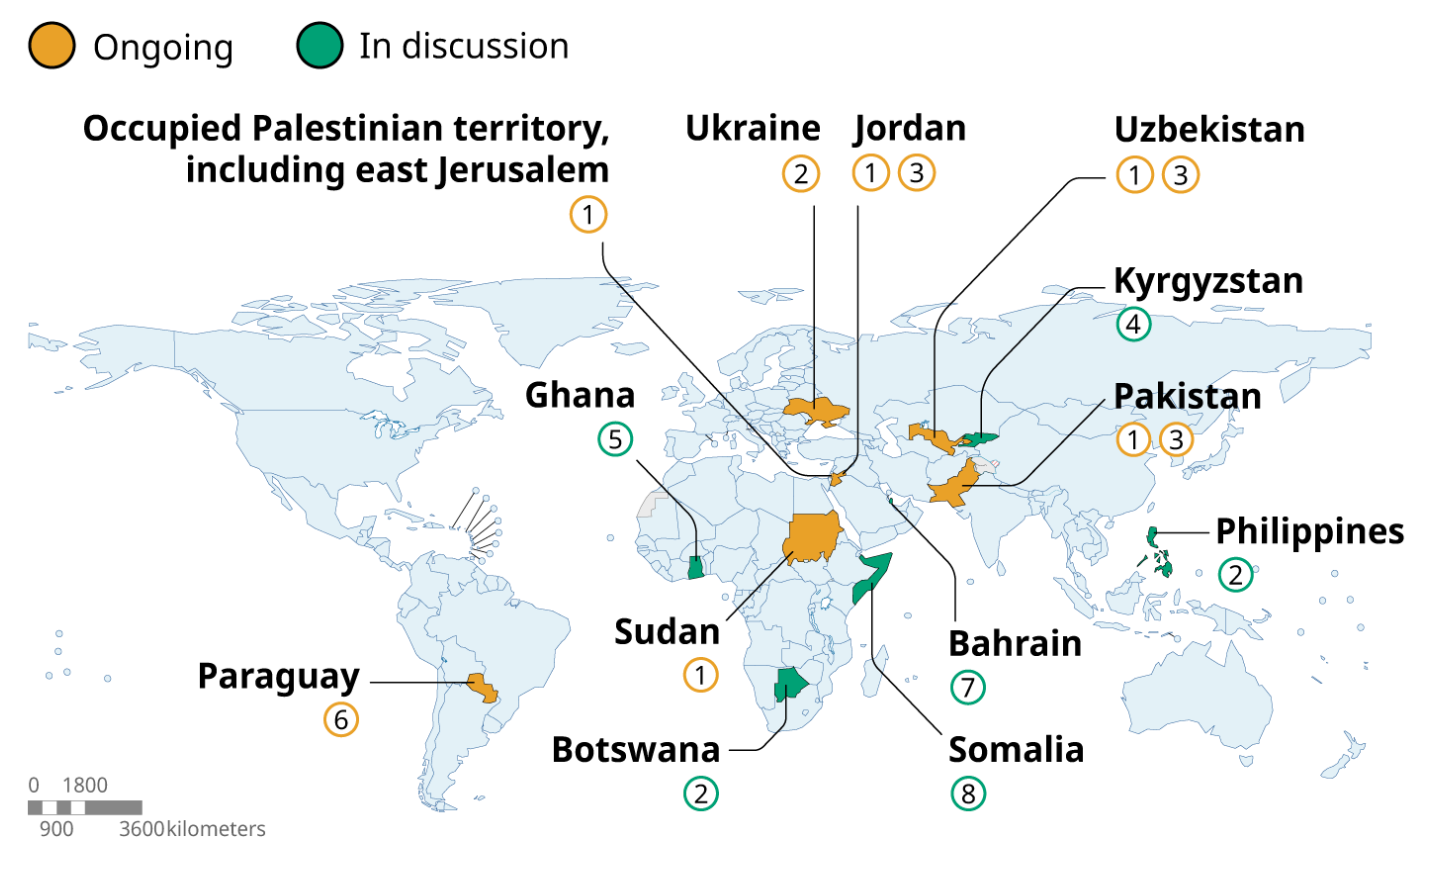
Snapshot of data and delivery work in countries by WHO
In fact, the WHO understood how important it was to turn complex data into clear narratives and visuals that it has adopted data storytelling as its go-to approach for sharing information with the general public. Good data storytelling helps them to identify the most impactful statistics and convey them in an understandable and relatable manner. It also ensures that these stories are memorable and easily retained by an audience that is often unfamiliar with the more technical aspects of the story itself.
But data storytelling isn’t just for organizations concerned with public health, it can have a real impact on the day-to-day performance of companies in any sector or industry.
Examples of data storytelling that can apply to any use case
Good data storytelling can make advanced analytics accessible to an audience. And if you want to see how data storytelling can apply to virtually any topic, business, or industry, look no further than the incredible examples put together by Chit Chart.
Take a look at their charts and graphics, and you’ll see how data storytelling can transform raw numbers and figures into a much more compelling and interesting data narrative.
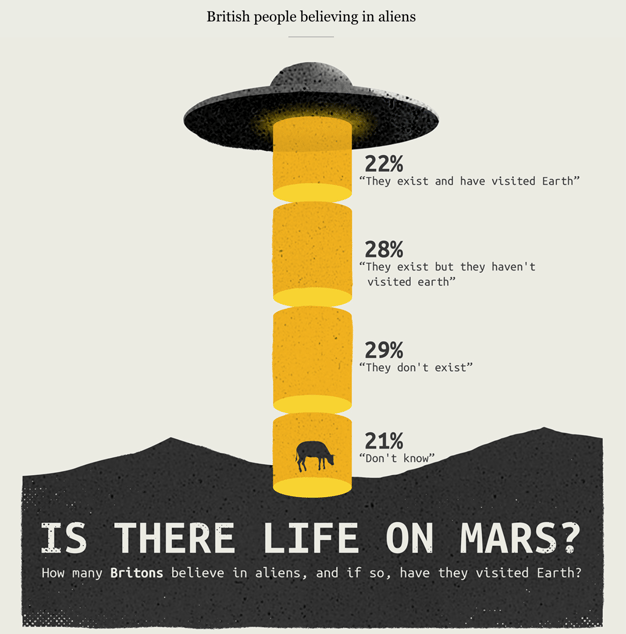 Chart designed by Chit Chart
You undoubtedly have access to an incredible amount of data, but good data storytelling will allow you to turn that into something that every reader can understand and, most importantly, use.
How data storytelling can help your business
Data storytelling can help you turn data analytics into meaningful business insights. It will help you to communicate your raw data in the most easily understandable way possible - and avoid situations where key insights can go unnoticed, unremembered, or even misunderstood by your audience.
Think of data storytelling as a way to ensure that your audience has that ‘a-ha’ moment. In the book Made to Stick, authors Chip and Dan Health explained how telling stories is one of the easiest ways that someone can make a presentation memorable.
.png?width=679&name=Blog%20Graphics%20(3).png)
In one of their most revealing experiments, they found that Sixty-three percent of participants could remember the stories that they had been told during a presentation, but only 5 percent could recall an individual statistic.
That only goes to show how most people are not suited to simply scanning a spreadsheet and extracting business insights from raw data. Good business intelligence storytelling can transform data analytics into impactful business insights.
Keys to good data storytelling
Don’t make the assumption that good data storytelling is simply a case of turning your data into an interesting looking infographic. It’s the importance of the narrative that will help your audience to get the most out of the information that you’re presenting.
So, before you make your next presentation or prepare your next report, think about the following:
- What does my audience want and need from the data?
- How advanced is their level of understanding when it comes to this data?
- How much context do they need?
- Which precise areas within the data are most relevant to them?
If you follow those steps, you are far more likely to be able to tell a story that will help your audience and team members to extract key business insights from your data analytics.
Want to know more about data storytelling?
Interested in finding out more about how good data storytelling could impact your business? Then why not take a look at how Toucan Toco can transform your data into meaningful dashboards and visuals.