


A Comprehensive Guide to Visualizing Your Accounting Reports
.png?width=88&height=88&name=portrait_agathe_face%20(1).png)
Agathe Huez
Publié le 19.04.22
Mis à jour le 13.01.26
3 min
One of the foundational aspects of any successful business is accounting reports: powerful documents that, when properly formulated and used, provide meaningful insights into the performance of your organization.

Tracking the financial health of a business, as well as its progress over time, is vital.
So, great, we’ve now stated the obvious.
Today, implementing accounting dashboard and reporting solutions is now simpler, less expensive, and, most significantly, more important than ever before.
Accounting pros are positioned (and pressured) to take advantage of the many benefits that these areas offer. Given that it can often be difficult to make sense of accounting reports, especially if you don’t have some sort of a background in finance, leveraging modern tools to make sense of accounting reports is becoming a necessity for business leaders.
In this article, we’ll cover the basics of accounting reports (including some of the most common ones you’ll likely come across), the reasons you need them, and how you can make them easy to understand and shareable with anyone, anywhere.
Let’s dive in!
Remind me: what are accounting reports?
Accounting reports (a more “official” definition here) are generally understood as statements that present the financial status of a company at a given point in time (or over a given time period).
Accounting reports compile financial information in a variety of formats and can be both simple and brief, or immensely complex. Accounting reports can be used in any number of ways, where to analyze product profitability, sales per region, or something else entirely.
Some of the most common accounting reports
Three accounting reports that you’ll quite commonly see across industries and businesses, irrespective of business size, are income statements, balance sheets, and cash flow statements. There are, of course, more, but here’s a little more information on these three usual suspects:
1. Income statements
Income statements show you how much your business has made (or lost) over a given time period. Income statements are usually divided into three distinct sections that cover:
- Revenue
- Expenses
- Net income
Income statements give you an overview of everything that influences your bottom line so that you’re left, in theory, with a clearer understanding of why your net income is what it is.
2. Balance sheets
Your balance sheet serves as a snapshot of your business’ financial health at a given point in time and is also usually divided into three distinct categories:
- Assets
- Liabilities
- Equity.
Balance sheets are aimed at making sure that the value of your assets equal the combined value of your liabilities and your equity. Balance sheets are also frequently used by banks before they approve loans, investors, and tax professionals.
3. Cash flow statements
Cash flow statements are essentially a highlighter of the inflows and outflows of money in a business over a given time period. Like the other accounting reports we covered, it’s divided into three sections:
- Operations
- Investing
- Financing Cash Flows
Cash flow statements consolidate the cash flows from the three sections shown above, calculating the net cash change for whatever time period you’re evaluating. Cash flow statements highlight the ability of an organization to generate and retain cash, and are mostly measures of operational efficiency.
Why do accounting reports matter?
Regardless of whether you’re a multinational enterprise or a small business, accounting reports are important. They help businesses keep a track record of their financial health, but also reduce the risk of inconsistencies that can bite you later down the road (whether its reporting inconsistencies to investors, paying taxes inaccurately, or something else entirely).
Having accurate, actionable reports helps you in many ways, such as:
- Conducting more accurate business valuations
- Getting approved for loans
- Determining insurance status’ and coverage requirements
- Avoiding theft and fraud (internally or otherwise)
The more accurate your financial reports, the better. If you have an objective, real-time view of your financial health, you’re better able to make strategic decisions that are backed by data.
How (and why) to visualize your accounting reports
Having accurate accounting reports is one thing, but making sure they’re easily understood by those that need to make use of them is another entirely.
Guided analytics or data visualization tools can help you bring insights into focus for operational teams and translate them into actionable next steps for better decision making.
The best platforms offer end-to-end analytics that are entirely devoted to eliminating the complexity that holds back everyday, non-technical business users from understanding their accounting insights.
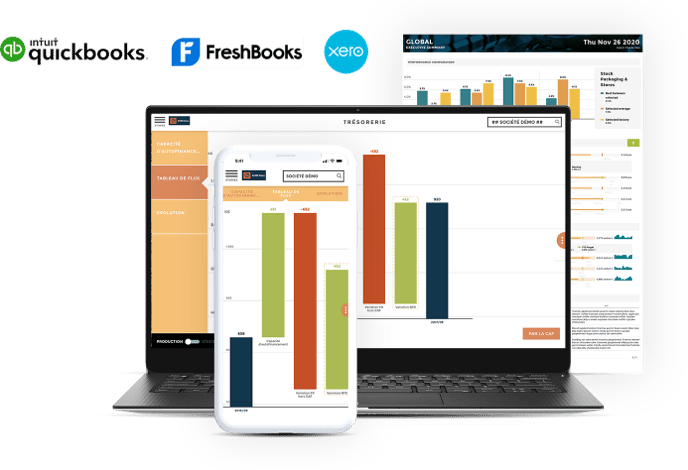
These services easily connect to any specialized software (Quickbooks, Xero etc.) or data source, whether on-premises or in the cloud, in minutes and without maintenance.
They even have things like built-in storytelling frameworks and guided designs to help you build reports without needing experience in coding or design!
Why does data storytelling matter for accounting reports?
Simply put, data visualization helps you to avoid data overload and improve your decision-making.
Everything is easier when the relevant data is presented ergonomically, in color, and is obvious.
Since the brain works visually, capturing 80% of information through pictures, it's important to be able to extract only the most useful information from the overabundance of data that we face each and every day.
Data visualization helps you do just that, making sure that your accounting reports are distilled so you can focus on the essentials and improve transparency and communication.
And to be clear: data visualization is far more than just eye candy – it’s a powerful medium through which you can communicate all the most important information from your accounting reports to everyone, comprehensibly.
THE LAST WORD
One of the major drawbacks of accounting, as it has been practiced historically, is the long time it takes to generate reports and find meaningful insights within them. The gap between searching for those insights and actually getting them leaves managers with very little time, and a lot of headaches, to drive meaningful change in the business.
The right types of accounting analytics solutions facilitate access to the data that matters most, eliminate ambiguity, and enable managers and stakeholders to understand the financial health of their business and make more data-driven decisions, anytime and anywhere.
.png?width=112&height=112&name=portrait_agathe_face%20(1).png)
