


How to Build Accounting Dashboards for the Best Business Outcomes
.png?width=88&height=88&name=portrait_agathe_face%20(1).png)
Agathe Huez
Publié le 19.04.22
Mis à jour le 13.01.26
5 min
Having visibility into key accounting metrics is critical to successfully running a business, and that’s why accounting dashboards are becoming an increasingly integral component to the health of financial teams, and companies, today.

Accounting dashboards visualize accounting key performance indicators (KPIs) and help business leaders have easy access, in real-time, to the insights that matter most to the successful management of their organizations.
Amongst the major drawbacks of accounting, as it has been practiced historically, is the long time it takes to generate accounting reports, and find meaningful insights within them. The gap between searching for those insights and actually getting them leaves managers with very little time, and a lot of headaches, to drive meaningful change in their businesses.
Accounting dashboards can make all the difference when it comes to providing real-time monitoring and data access to non-technical business users who need to make important decisions daily.
Differentiating your accounting reporting offers a litany of benefits, including helping you win and retain more customers, save time, and improve decision making.
But more on that later.
First, it’s important to note that not all accounting dashboards, or accounting reports, are created equal. They come in many forms, varying across product lines, companies, and industries. That said, accounting dashboard implementation is now simpler and less expensive than ever before, positioning accounting pros to take advantage of the many benefits they offer.
So…where to start?
What does a great accounting dashboard look like?
As we mentioned, not all dashboards are created equally, and the same is true for accounting dashboards. While variance between companies and industries will virtually always exist, there are several things that you should seek to include in your accounting dashboards:
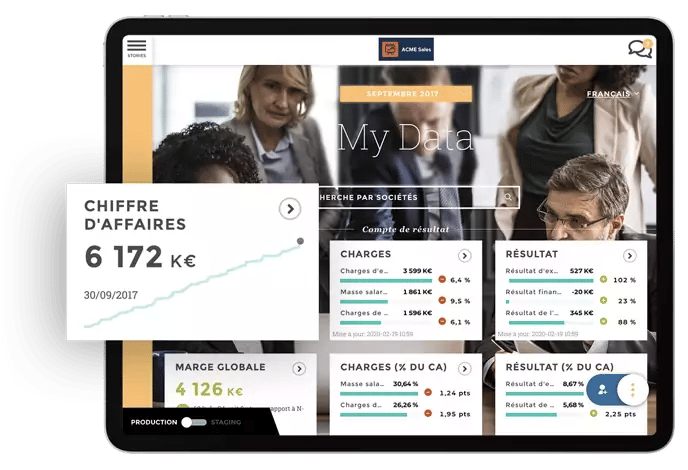
- Make sure the information is simple, useful, and actionable. The best accounting dashboards display warning signs and indicate problems that help you take action. You should be able to dig into your data as much as you want within the analytics solution, but the main display should provide an overview of only the most relevant information for your use case.
- Pay attention to data visualization best practices so that you can best communicate raw information in a way that is easy to understand for everyday business users
- Make sure your reports are digital, dynamic and clear. They should be accessible any time, and anywhere, for all team members without the need for extensive training. That should mean that you only have to build it once, but can use it everywhere.
- Make sure your accounting analytics are easy to understand, with built-in context. That means key insights should be delivered on a single, shared and secure interface that is easy to understand by your team on the field, prospects, and customers.
- Consider taking advantage of a solution that offers a built-in user experience. That means:
- Design experts won’t be required to deploy pixel-perfect accounting reports in record speed
- You won’t have any expensive code to write or maintain
- You won’t need to hire and retain consultants to make the most of your solution
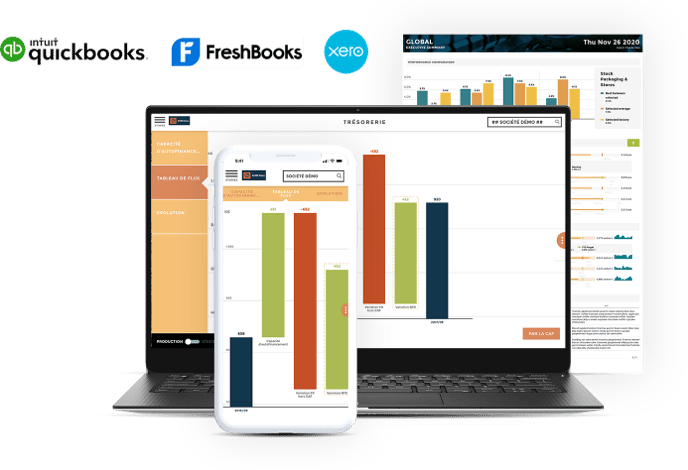
- Make sure you can easily connect to any specialized software (Quickbooks, Xero etc.) or data source, whether on-premises or in the cloud, in minutes and without maintenance.
- Include a summary of the most important KPIs that you want to track. The KPIs you should select will vary depending on your context, but here are some that might be most relevant.
- Get granular, so that anyone can find the information that is most relevant to them
- Allow users to track key data sets, with both quick overviews of figures over a given time period, as well as detailed summaries with drill-downs
- Create an executive summary for accounting leaders and stakeholders that include easy, up-to-date visual references to help them review the complex, and continually changing, figures that they need to analyze to guarantee long-term financial health.
And we get it: this can all sound overwhelming. The good news is that you’re not alone. Get in touch if you need help!

How can accounting dashboards help you?
We said it before, but we’ll say it again: dashboard implementation is now simpler and less expensive than ever before, positioning accounting pros to take advantage of the many benefits they offer. Here are 10 of those benefits that we think are particularly worth remembering:
- Improved speed: accounting professionals and teams are always under intense pressure to deliver relevant insights quickly and to the right people, clearly and reliably. If a request is sent and a response is only received a week (or more) later, the insights will likely be irrelevant by the time they’re delivered. The invaluable solution that accounting dashboards deliver is that they enable businesses to quickly comprehend all the data they need, accurately and in a timely manner.
- Course correction: the real-time data and ease-of-understanding insights that accounting dashboards provide mean that you can (finally) make informed decisions, quickly, to improve key business outcomes. You’re able to focus on what matters, and leave the rest behind.
- More autonomy: the right dashboards grant the insights that business users need, right where they need them, without reliance on experts or the need for a PhD in data analytics.
- The ability to validate and drill-down: accounting dashboards help teams to validate their findings and drill down into the nitty gritty at whatever level they need to.
- Increased productivity: less time spent on maintenance and reporting means more time spent on the core priorities of the business. Accounting dashboards lead to a more stable financial environment and, in many ways, more secure long-term financial health. Data at your fingertips, a plethora of analytics options from one source of truth, and financial KPIs remove tedious analysis and reporting. That means you and your accounting team save time, effort, and money since you’re no longer burdened with the time-consuming grunt work of manual reporting.
- Better visibility and insights in real-time: many accounting dashboards today have the ability to set off intelligent alarms that immediately spot any inconsistencies or red flags that you’ll want to know about now. Not in days, weeks, or months. You’re able to share data, in real-time, with those that need it, so you don’t need to wait for the accounting team to make important (time-sensitive) decisions. Real-time accounting dashboards aggregate all your most important metrics in a single source of truth, so you and your team can be in the know.
- Better organization: the best accounting dashboards lack the clutter that have, for too long, slowed down analytics processes. That’s because dashboards are not only clean and easier to navigate, but they also contain intelligent, easy-to-understand visualizations that help teams to optimize and understand trends over time.
- Mobility: the ability to access dashboards and insights on the fly is vital, today more than ever. Modern dashboarding solutions, integrated with cloud-based accounting data, enable more accessibility than ever-before, anywhere and on any device.
- Immense customization: we’ve said it several times, but it’s worth repeating: no two accounting dashboards are the same, so the KPIs and insights one team wants will differ dramatically from another. Accounting dashboards offer the freedom to customize your interface to only include the information that matters. That means that you only have what you need, with none of the extraneous information that generally leads to nothing but headaches.
- Competitive advantages: not only do dashboards enable you to provide additional insights to your clients and establish new service offerings, but they can also help you identify new ways to optimize revenue growth and mitigate risk.
Metrics to include on your accounting dashboard
There are a litany of KPIs that you could elect to include in your dashboard. This will vary depending on your product, industry, department, function and, of course, objectives for the dashboard. That being said, there are loads of great resources with comprehensive lists of accounting management KPIs for you to consider. But before you explore those, here are some guiding principles that are relevant to your dashboards regardless of the metrics you select:
- Delineate KPIs by departments (accounts payable, accounts receivable, etc.) to make sure that your team is delivered the insights that are most relevant to their success (and, subsequently, the success of your business).
- Define SMART goals for those metrics. SMART is one framework (amongst many) that helps to clarify ideas, focus efforts, and use your resources more productively.
- Track your progress: this may seem simple, but it's really important to understand your progress over time.
- Align your metrics with your processes: your business is unique, so your metrics likely will be as well (at least to some degree).
- Lock in context: make sure that the KPIs are evaluated within the context of your entire organization, not in isolation.
How to get started with your accounting dashboards
Building and deploying differentiated analytics dashboards is easier than ever before.
With Toucan, you can build your first data story in less than 10 minutes. We’ll help you summon the courage to deliver live, clear, and easy-to-understand insights painlessly. Our cloud-based, guided analytics platform has been built to reduce the complexity of bringing insights from data to business users. So everything, from data connection to distribution of your dashboards at any time and on any device, is all business-user friendly.

.png?width=112&height=112&name=portrait_agathe_face%20(1).png)
