


AARRR Pirate Metrics: Everything You Need to Know
.png?width=88&height=88&name=portrait_agathe_face%20(1).png)
Agathe Huez
Publié le 11.02.22
Mis à jour le 13.01.26
7 min
We love Pirate Metrics. The name itself is fun: AARRR!! Pirate metrics, or “AARRR”, is a term coined by entrepreneur and investor Dave McClure. Despite being popularized in 2007, pirate metrics still hold a lot of relevance, especially in the start-up space.
AARRR helps businesses think through five of the most important user-behavior metrics that determine the success of their organization, and helps to narrow the focus on only those metrics that directly (or perhaps most significantly) affect business health.
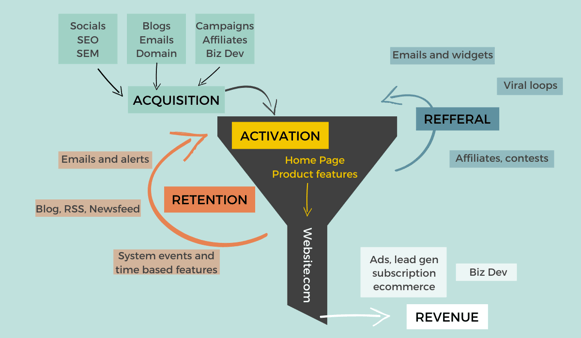
The AARRR acronym is comprised of:
- Acquisition metrics - how do people find us?
- Activation metrics - are these people taking the actions we want them to?
- Retention metrics - do these activated people continue to engage with us?
- Referral metrics - do these people like our service enough to tell others about it?
- Revenue metrics - are these people willing to pay for our products / services?
Without tracking, understanding, and leveraging AARRR metrics to inform decision-making, businesses are unlikely to be successful in the long-term. Furthermore, they won’t have a solid way to know whether or not they’re actually successful in the first place.
The goal of this article is to help you understand, and better leverage, pirate metrics for your business. So, without further ado, let’s jump into the first one component of AARRR: acquisition.
Acquisition: How Are People finding Us?
Acquisition is the intuitive first step in the Pirate Metrics framework and is a natural starting point for most teams: establishing efforts to introduce people through your product or service. There are a litany of acquisition channels that are probably quite familiar to you. Not sure what we mean? Some common acquisition channels include:
- Organic (think SEO) and Direct Traffic
- Outbound Sales and/or Marketing
- Digital Ads
- Affiliate Marketing
- Social Media
- Apps or Widgets
Any way that someone is able to find your business, whether through network referrals or something else entirely, can be considered an acquisition channel.
Each acquisition campaign should have channel-level analyses baked in that help determine whether money is being spent efficiently and effectively.
Whether you’re looking to drive conversions on your website(s) and landing pages, or want to better understand how your outbound campaigns are performing, acquisition metrics are fundamental to optimization.
Acquisition metrics, in this context, therefore focus on things like conversion rates, lead volume, and lead velocity, and other such widely tracked marketing management KPIs.
Acquisition metrics are generally approached with the goal of measuring both the quality and behavior of traffic, leads, or the like. Both of these things can be monitored in a variety of ways and depend on the channel that's being evaluated, whether that's a Google Analytics dashboard to monitor your web traffic or an analytics cockpit in Salesloft to monitor how your team is performing with regards to converting leads into opportunities.
Once you have visibility into your various acquisition channels the goal is then, somewhat obviously, to improve performance. Having a solid analytics strategy in place, as well as the next steps around how you can best run A/B tests or launch entirely new discoveries, is important in improving the marketing and sales functions and, subsequently, the success of your organization as a whole.
Monitoring and tweaking each step in a given channel will help.
Activation: Are These People Taking the Actions WE Want them To?
While acquisition in the pirate metrics/AARRR framework is all about generating awareness and bringing in the right flavor of web traffic or leads to your business, activation takes things one level deeper, beyond baseline user actions. The focus of acquisition could be thought of as focusing on conversion.
As far as activation is concerned, you’re going to want to focus on the conversion metrics that illustrate the success of channels and campaigns, rather than high-level conversions: the desired actions that you want people to take after their first introduction to your product or service.
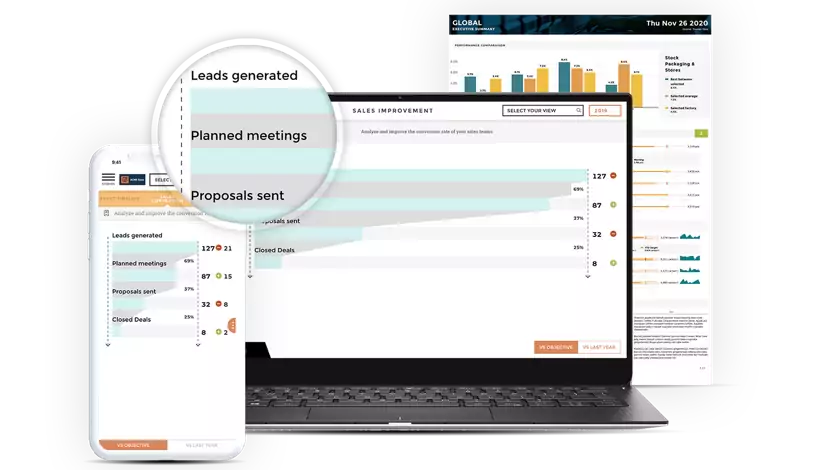
So, for example, while the conversion from home page visits to a free trial form submission is a good starting point, the idea here is to build out a representation of your entire sales and marketing funnel in your analytics tool.
To better bring activation to life, an “active” user would be someone who not only comes to your website via your acquisition channels but who makes some indication that they see the value of your product and service and tries it out (or speaks to someone on your team).
Activation should generally be measured in the form of those users, leads, or visitors who take the action that you want them to take, such as requesting a demo, signing up for a free trial, or downloading a piece of content. Examples of activation actions could also include:
- Viewing different website pages
- Playing around with additional features
- Spending a certain amount of time on your app
- Signing up for your newsletter
Retention: are our users continuing to engage with us?
While acquisition is tremendously important, today’s businesses can’t hope to be successful solely by acquiring new customers. New customer acquisition is more expensive and unsustainable when compared to retention. Retention is key, not only because it’s easier to retain customers than attract new ones, but also because there’s generally an opportunity to upsell and/or cross-sell your customer base, increasing important marketing metrics like customer lifetime value.
Tracking retention is going to differ from industry to industry, and even from business to business.
For example, if you’re an online retailer, one of the most important retention metrics to measure is the volume of repeat customers you have on a seasonal basis for things like summer wear or winter gear. If you’re a SaaS company, on the other hand, you’re going to want to measure churn (when a customer downgrades or discontinues their subscription) and look for ways to reduce it.
While the way in which businesses measure and react to retention metrics varies, one thing stays true: retention metrics are some of the most important figures to track, understand, and use to impact business decisions.
Why are retention metrics so important? Well, they’re a strong indicator of the value that you’re offering to your customers and also highlight the main areas of improvement you should focus on as a business. Poor retention is a surefire way to be unable to scale.
Strong retention, on the other hand, offers a nice segway into the next bucket of the pirate metrics / AARRR framework: referrals.
Maintaining a happy, healthy customer base means you can start focusing on referrals.
Referrals: do our users like our offering enough to tell others about it?
Referrals are, oftentimes, the bread and butter of successful businesses. When happy customers are willing and excited to share your product or service with others, you’ve now established one of the highest converting, cheapest methods of acquiring new customers.
But, while referrals are a golden nugget in the business world, they’re not so easy to track because people employ all sorts of tactics to tell others about things they like using.
Referrals often end up being attributed to organic or direct acquisition efforts. Why? When you think about it, if someone talks about your business, the people that are listening will likely jump onto their favorite search engine and type in your organization's name. They’ll come to your website from Google, and it's difficult to determine how they heard about you.
That being said, you can better track referrals by doing things such as:
- Creating emails with referral promotions
- Starting referral contests
- Make your product easier to share

Even though it's possible to track referrals, it's always going to be an imperfect process (even with the right analytics in place). So, while it’s important, the thing to focus on is your customer base and encouraging or incentivizing them to spread the word.
How else can you make your business successful using the pirate metrics / AARRR framework? The answer probably won’t come as much of a surprise: revenue, revenue, revenue.
Revenue: we have bills to pay!
Even heavily funded start-ups that have the privilege of focusing on product development and fast growth need to (eventually) implement a strong sales and marketing revenue-generating engine.
It’s important to identify revenue targets that help you understand whether your costs for acquisition, activation and other efforts are actually leading to profitability. This includes defining customers who are generating:
- Minimum revenue
- Break-even revenue
- Revenues that exceed the cost of acquiring new customers
Just as with the other pirate metrics, however, revenue is rarely measured in the same way. If you want to grow successfully and sustainably, you’re likely going to need to track a variety of revenue-related metrics, including top and bottom-line revenue.
While tracking revenue at the macro level is important, it’s a good idea to break things down more granularly, as we showed in some of the examples above, such as understanding your average revenue per customer, per product or service offering, and so on.
Each micro-level revenue metric enables you to better communicate with your customers and prospects, optimize your product and pricing strategies, and improve your efficiency as a whole.
This takes things like cost-per-lead or cost-per-opportunity acquisition metrics one step further. With advanced full-funnel marketing and sales analytics, organizations are better able to track spend and profitability in a variety of areas, getting more visibility into optimal channels as well as areas in which they can and should be focused on improving.
To put it simply, measuring revenue on the customer and channel level is one of the best ways to more effectively allocate sales and marketing budgets.
Moving forward
The pirate metrics / AARRR framework is a great foundation for businesses to focus on the metrics that are most important for their growth and sustained success. As you gather data, it's important to test and determine where you can most improve user engagement at each of the AARRR stages.
Yet while the importance of data analytics is now widely accepted, many organizations still struggle to implement and leverage them correctly.
It’s not surprising - most teams neglect analytics simply because they’re overwhelmed by the sheer volume of data and analytics tools out there. This is one of the reasons that pirate metrics are so useful - they simplify what’s become…not so simple.
In our attempts to make analytics fast, powerful, all-seeing, and all-knowing, we’ve also made them incredibly hard to use. So complex that only experts can make full use of them. Remember when you could do basic work on your own car? Kind of like that.
The question then becomes, what can we do?
Guided business analytics
The solution, in addition to leveraging things like Pirate Metrics, is not to make every business user a data expert so that they can use the complex tools that are on the market today. Rather, we have to make analytics easier for business people.
That's why, at Toucan, we’ve chosen to pursue the route of guided analytics: analytics that assist users in understanding data and using it to collaborate and drive results.
That means providing:
- A map to where you need to go: something that helps you understand what you're seeing and why, everywhere, always.
- Advanced shareability: making collaboration difficult is, well, stupid. So we don't. That's why creating analytics that have tips, annotations, and built-in collaboration features are something that we're very proud of.
- Universal deployment: something that helps you understand what you're seeing and why, everywhere, always. Whether on scheduled PDF report deliveries, wall displays, embedded in products, or on mobile, it doesn't need to be difficult.
So, you shouldn't feel dumb, under-trained, or need to go find an expert just because you dared to do more with your data.
Good luck!
.png?width=112&height=112&name=portrait_agathe_face%20(1).png)
