


5 SaaS Growth Metrics to Monitor in the Era of Profitability (+ Dashboard Examples)
.png?width=88&height=88&name=portrait_agathe_face%20(1).png)
Agathe Huez
Publié le 27.12.23
Mis à jour le 13.01.26
5 min
Being capable of generating growth is critical for SaaS-based tech startups looking to make the most of their offerings. The existence of COVID has caused an explosion in the uptake of digital tools, pushing companies toward digital, collaborative work environments – but these new dynamics have caused unreasonable performance figures across tech companies, meaning investors often overestimate a company’s ability to develop its business model and grow sustainably.
With many tech companies crashing and an estimated 63% of tech startups failing, it’s more important than ever to have strategies to generate continued growth. Investment funds seek startups capable of attracting new customers and validating a market’s interest in the product regardless of annual cash burn, making your company’s profitability integral to its future success.
But what SaaS growth metrics are crucial to help tech startups thrive, and how can you manage your SaaS metrics effectively? This article will outline five crucial metrics to monitor in the era of profitability and provide examples of creating dashboards to help you manage your SaaS KPIs. Let’s get started!
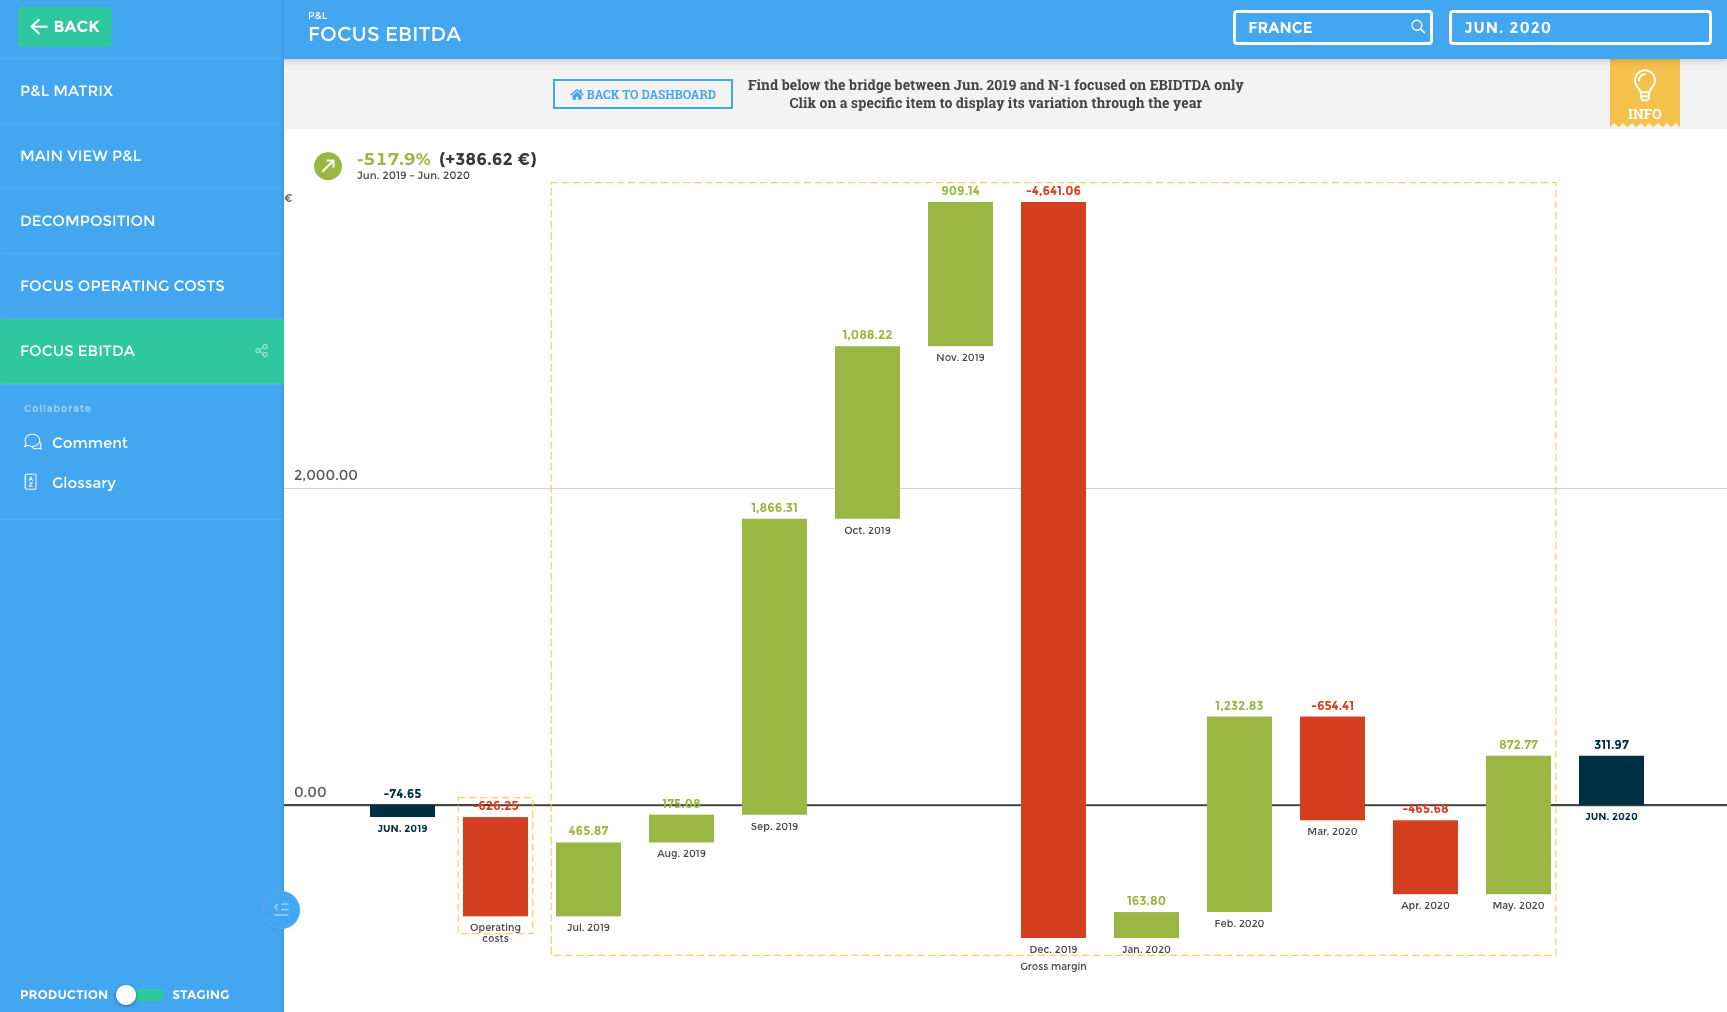
1. Monitor Profitability With EBITDA
The first step to determining essential SaaS growth metrics is monitoring your company’s profitability with EBITDA. EBITDA, which stands for earnings before interest, taxes, depreciation, and amortization, measures your company’s core profitability. This metric allows you to evaluate your organization’s operating performance and is often used as a loose proxy for your company’s cash flow throughout your operations.
EBITDA is a variation of your operating income (EBIT) but excludes some non-cash expenses. By using EBITDA as one of your SaaS metrics, you remove the expenses you have more control over, such as your depreciation methods and debt financing. Measuring your EBITDA gives you a concise overview of your company’s profitability, and understanding this KPI is crucial to comparing your performance against your competitors.
Understanding your EBITDA is especially important when your company is struggling to make a net profit, as it thoroughly evaluates your necessary expenses to identify where your business is failing to profit. EBITDA is calculated with one of the following formulas:
- EBITDA = Operating Profit + Depreciation + Amortization
- EBITDA = Net Income + Interest + Taxes + Depreciation + Amortization
While there are some criticisms of EBITDA because the formula doesn’t account for assets losing their value over time, EBITDA is still one of the most helpful SaaS growth metrics to consider when assessing your company’s profitability.
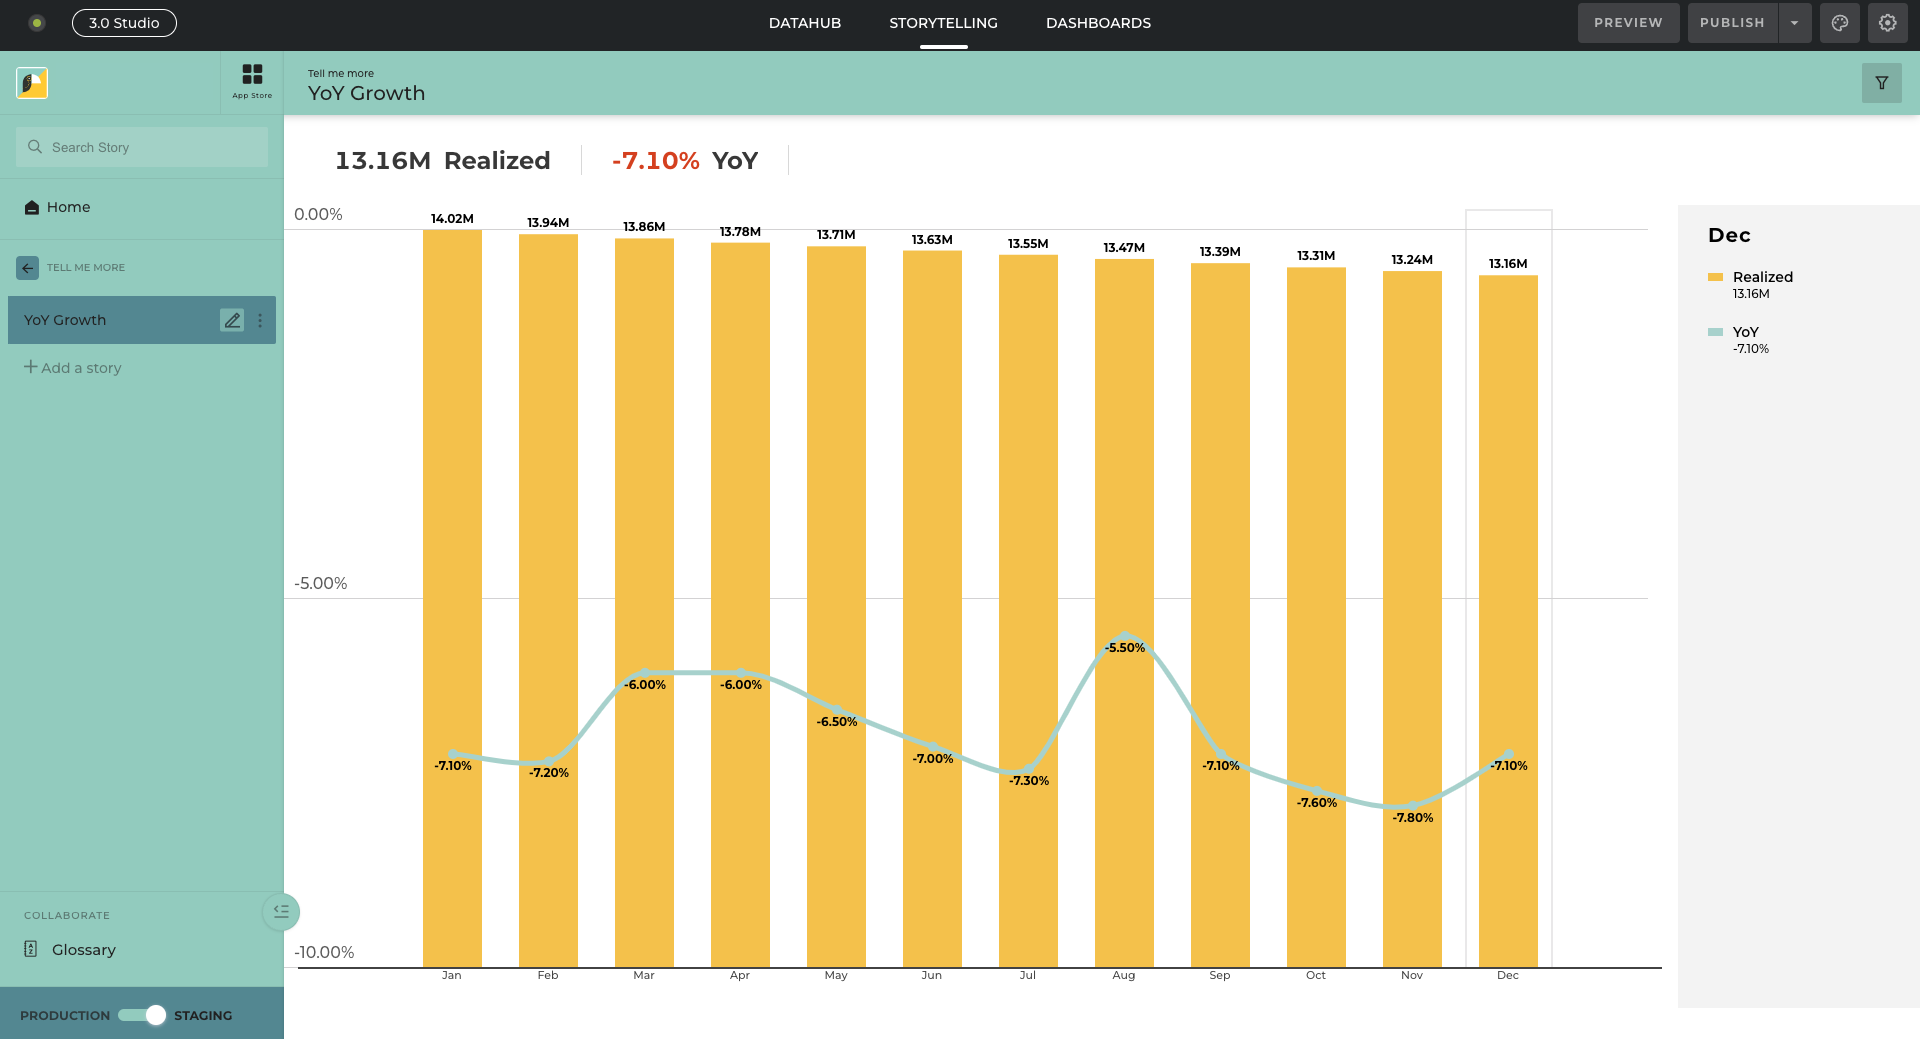
2. Controlled Growth With YoY Growth of ARR
Another of the most critical SaaS growth metrics is the year-over-year (YOY) growth of your annual recurring revenue (ARR). This metric is helpful because it allows SaaS companies to assess their success and profitability while identifying potential risks restricting profits. Your company’s ARR is the total revenue from recurring revenue sources, such as paid subscriptions.
Understanding the change in your annual revenue over a specific period allows you to determine whether more customers are adopting your organization’s products or services, and monitoring your YoY growth of ARR is essential to determine whether your services are providing value to your customers or if changes are necessary to improve customer satisfaction.
You can calculate your YoY ARR growth by subtracting the previous year’s ARR from the current year’s ARR and dividing this number by the preceding year’s ARR. This measurement is possible using the following formula:
- ARR Growth Rate = (Current Year’s ARR - Prior Year’s ARR) / Prior Year’s ARR
This formula will result in a percentage that allows you to assess how much the value of your services has decreased or increased over the years. If your ARR growth rate steadily increases over the years, your company is maintaining a positive growth rate and profitability. ARR growth rate is one of the most important SaaS KPIs because it clearly answers whether your services are profitable and allows you to adjust your current strategies to attract more customers.
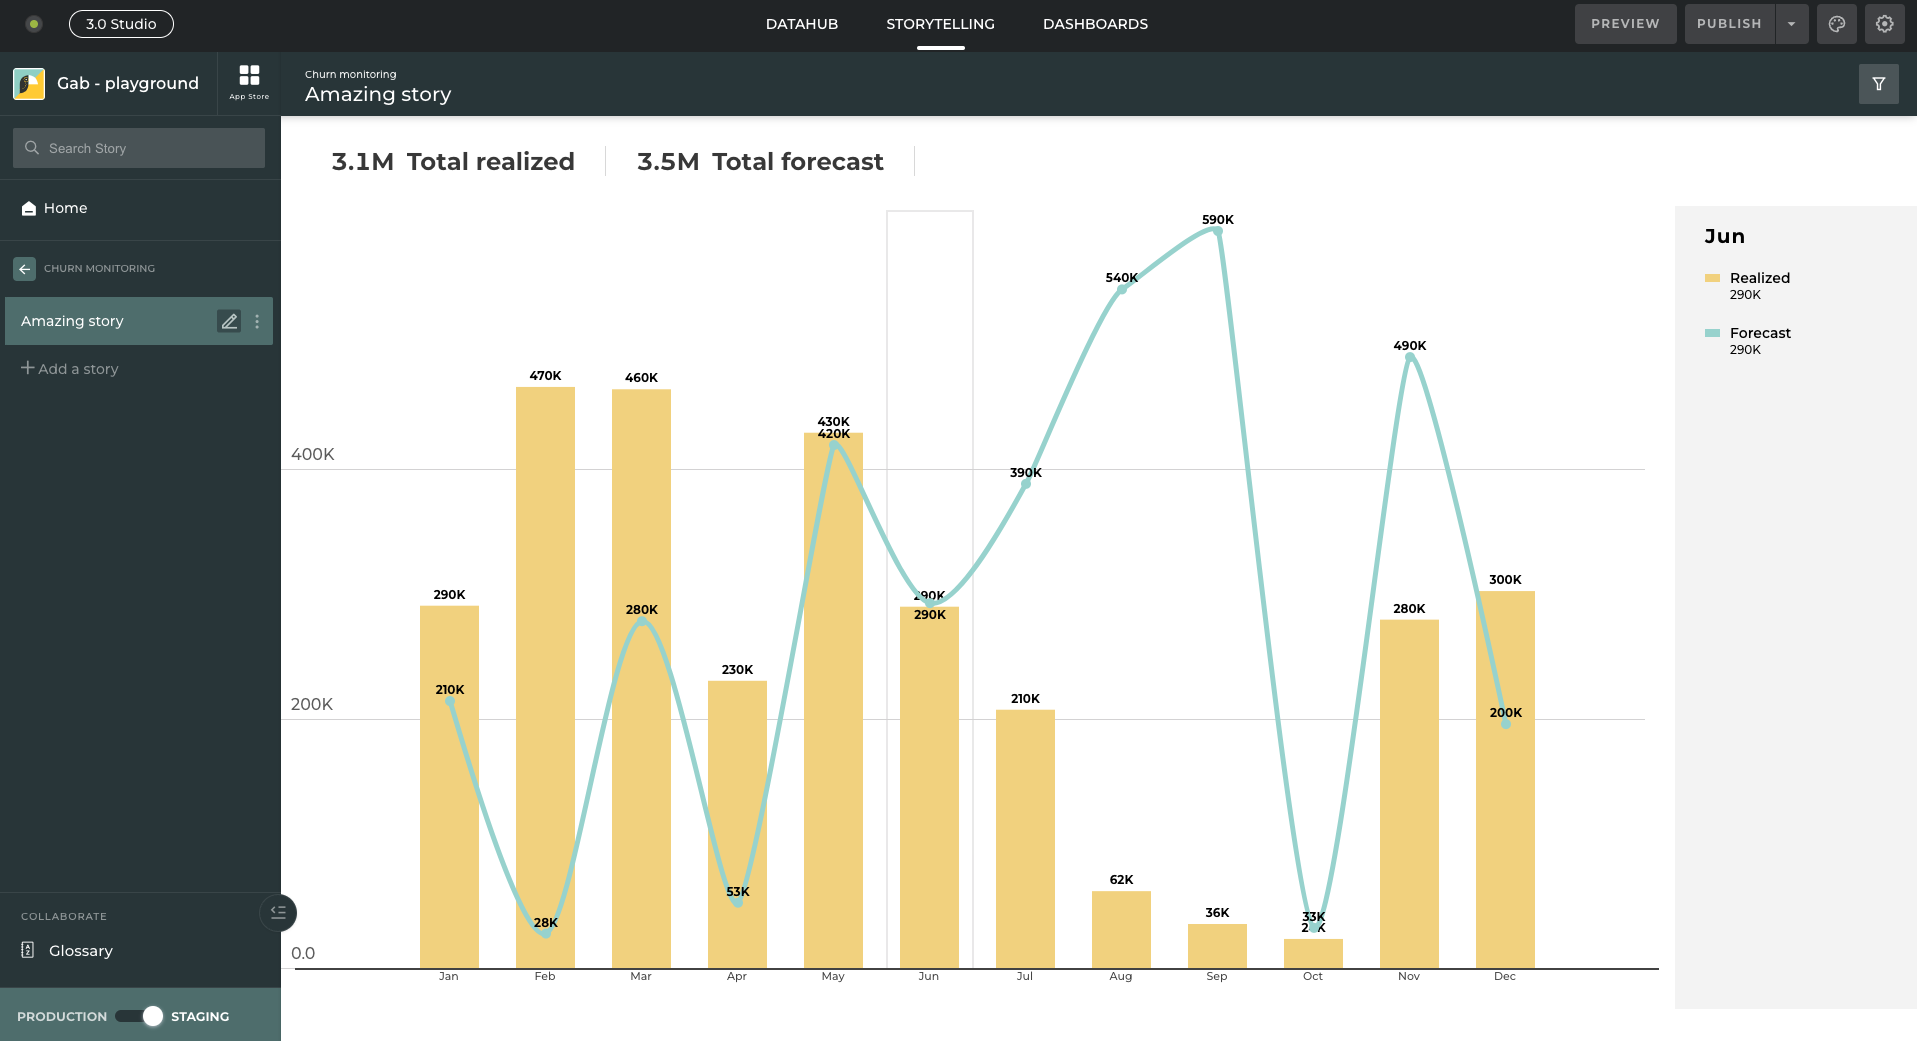
3. Monitoring Churn Rate to Keep a Strong Client Adhesion
Your company’s churn rate is crucial to its success and profitability. The churn rate describes the number of customers who stop using your product in a specific period, such as monthly or yearly. When customers cancel their subscription to your SaaS services, your churn rate increases.
For example, a company that began a financial period with 100 customers but lost 10 customers within a period would have a churn rate of 10%. When churn rates exceed customer acquisition rates, your company struggles to maintain profitability – allowing you to refocus your strategies to meet customer expectations more efficiently.
You can calculate the number of customers that stop using your products or offerings within a specific period with the following formula:
- Number of Customers Lost in a Period / Number of Customers at the Start of the Period
Your organization’s churn rate is crucial because it gives you a clear understanding of where your company is failing to meet customer needs. Regularly assessing your churn rate allows you to readjust your offerings and strategies to improve customer retention in the following periods.
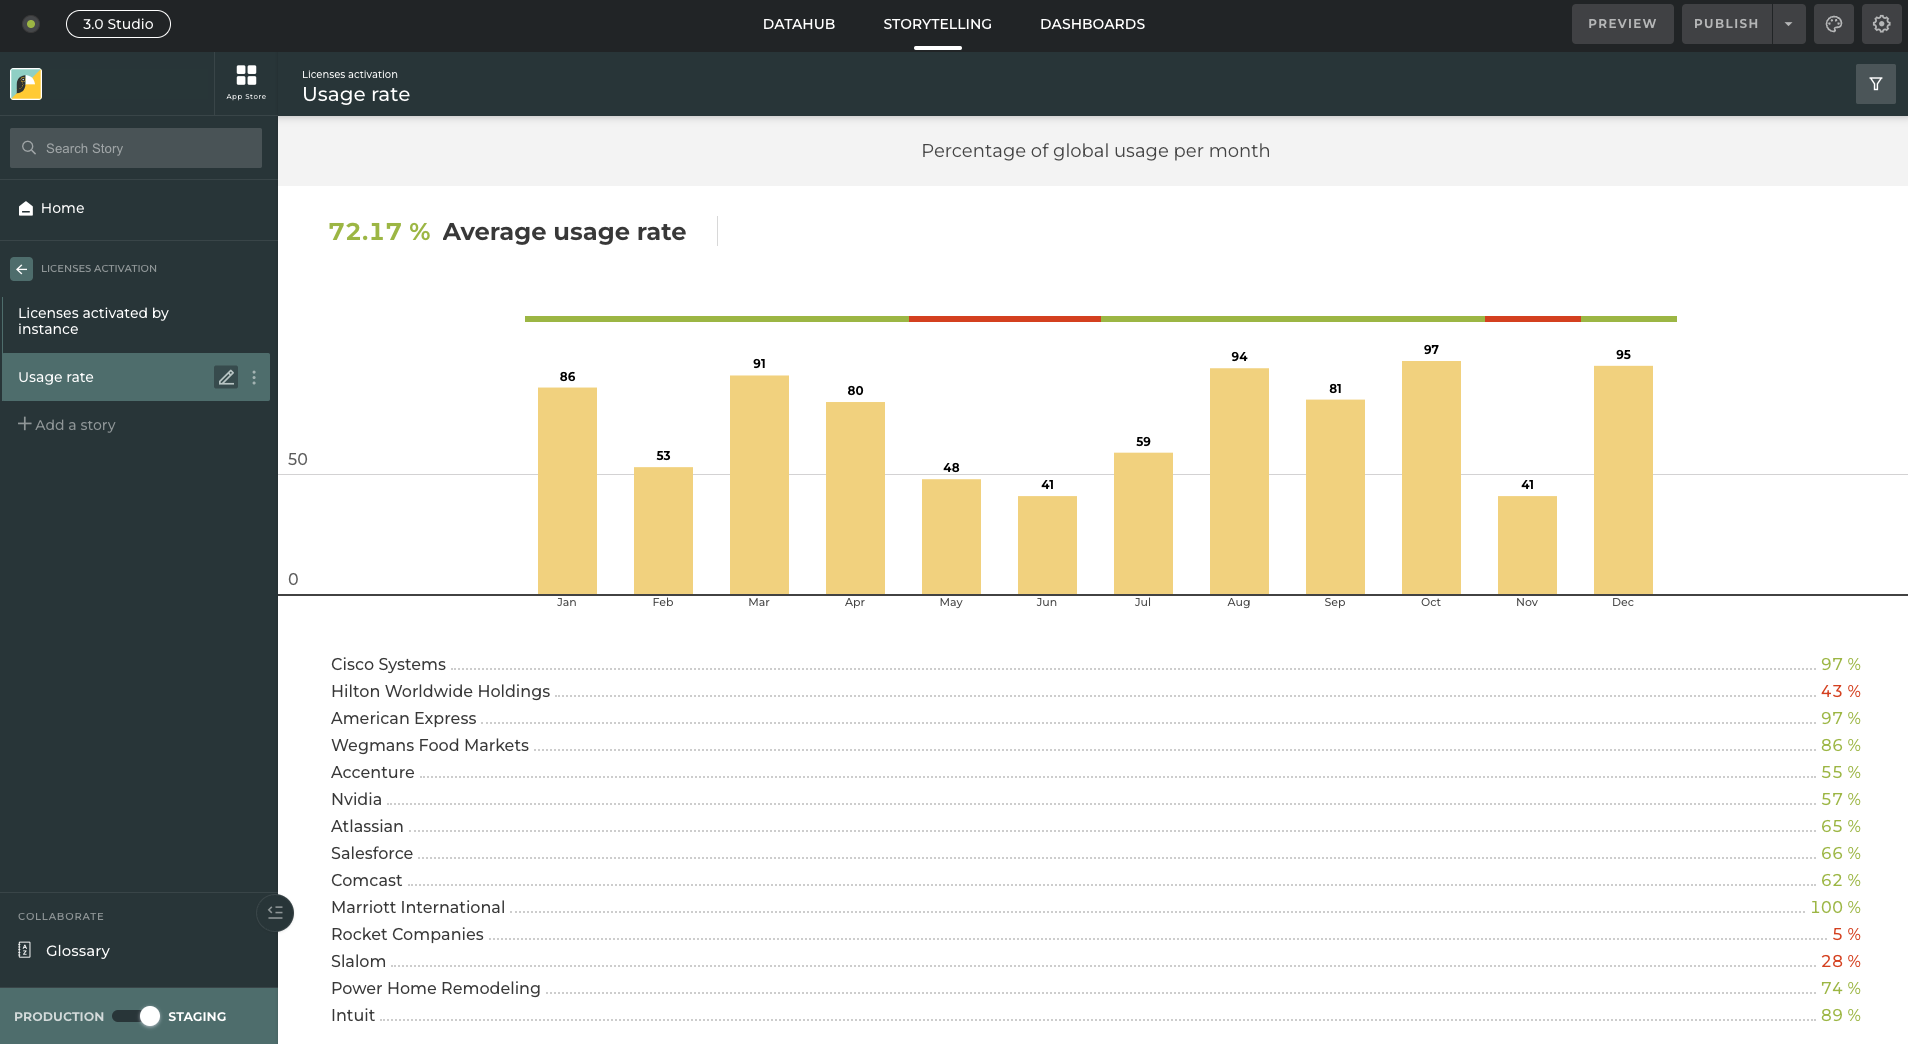
4. License Usage Rate for ICP Customers
Validating a strong product market fit is possible when considering your license usage rate for your ideal customer profile (ICP). License usage rates are crucial SaaS growth metrics that describe how much your ICPs use the licenses they’ve purchased from your organization. The license usage rate indicates customer satisfaction and engagement with your products or services.
A higher license usage rate indicates that customers find value in your products and services and are more likely to continue using these offerings. These customers will also likely purchase additional licenses from your organization to continue utilizing your offerings.
A low license usage rate indicates that customers aren’t finding enough value in your products, allowing you to identify customer churn risks. By monitoring license usage rates for your customers, you can assess and address potential issues and areas for improvement with your offerings.
One struggle companies often have with license usage rates is determining how to measure engagement with specific products or services. An option for assessing license usage rates among your ICPs is to divide the number of active monthly users by the number of licenses purchased in a specific period. Ideally, your SaaS growth metrics for license usage rates should fall between 70% and 80% usage. If your usage rate falls below 50%, it indicates you need new strategies to maintain customer interest and avoid high churn rates.
5. Assessing Sales and Marketing Efficiency
Sales and marketing are vital to your overall success and the longevity of your business. Determining how much you get out of every dollar you spend on sales and marketing can help you assess your company’s performance and take actionable steps to improve your retention rates.
Sales efficiency describes a ratio that measures how much your company generates for every dollar spent on marketing products and services. This number not only gives you an understanding of how successful your marketing efforts are – it also helps you understand the speed of your company’s sales efforts within a specific period. This metric also indicates how cost-effective your current sales efforts are for your business.
Your company’s sales and marketing efficiency measures the revenue generated based on your total sales and marketing costs. Determining these SaaS metrics is possible by dividing your total gross revenue or gross ARR by your sales and marketing expenses for a specific period. Ideally, you’ll want a sales and marketing efficiency of at least one to indicate that your business is successfully using its sales and marketing budget.
The Benefits of Understanding Your SaaS Growth Metrics
There are numerous advantages to understanding your SaaS growth metrics and SaaS KPIs. Among the core advantages of understanding your SaaS metrics are the following:
- Understanding your SaaS growth metrics lets you conduct a thorough performance evaluation and compare your metrics against industry benchmarks.
- Your SaaS metrics provide you with resources for improved financial management, allowing you to optimize your spending and improve cost efficiency and efficacy.
- SaaS growth metrics provide insights for user acquisition and retention, enabling you to determine the effectiveness of your current strategies.
- SaaS KPIs are crucial for product development and improvement, allowing you to address potential issues impeding your profitability.
- SaaS metrics provide information for scalability and growth strategies, allowing you to determine expansion opportunities.
- SaaS growth metrics promote operational efficiency, providing you with the resources to identify inefficiencies and determine areas for greater improvement.
Enhance Your Growth With Toucan’s Data Storytelling
Finding actionable solutions to boost your SaaS growth metrics is crucial to ensuring your business is sustainable and profitable and attracting potential investors to contribute to your c company’s growth. Toucan is a customer-facing analytics platform that allows you to engage your customers through unique data storytelling, providing you with the resources you need to transform into a data-driven organization.
Toucan provides a built-in storytelling framework and dashboards to conceptualize your data, understand your SaaS metrics, and determine untapped growth opportunities. By choosing Toucan for your data storytelling needs, you can transform your data into helpful insights that help your company expand and succeed.
See Toucan in action and request a demo today!
.png?width=112&height=112&name=portrait_agathe_face%20(1).png)
