


4 Financial Dashboard Examples And Templates
.png?width=88&height=88&name=portrait_agathe_face%20(1).png)
Agathe Huez
Publié le 19.08.22
Mis à jour le 13.01.26
4 min
A financial dashboard is a tool that helps track finance KPIs across every department in real-time. Financial dashboards can be used for cash management, marketing budgeting, profit and loss analysis, and CFO analysis.
In today's data-driven world, finance professionals are under pressure to deliver. The COVID-19 pandemic, impending recession fears, and inflation caused by geopolitical conflicts are putting even more pressure on experts to save resources wherever possible while still operating at an optimal level.
Enter financial dashboards.
Embedded data analytics is experiencing higher adoption rates and usage by finance professionals. Unprecedented reporting capabilities, mobile optimization, collaborative tools, and mobile optimization are all aspects of data visualization tools that finance professionals have been begging for. By using financial dashboards, a business opens the door to limitless, untapped potential. Finance experts now have access to every piece of data at their fingertips. No more guesstimations, gut-driven decisions, and data headaches. If used properly, embedded analytics provides finance professionals full ownership of their data, and ensures that all members of the team are on the same page.
Here we present 4 finance dashboards created for various roles and levels within the finance industry or department:
Cash Management
This financial dashboard template provides insights into a firm's liquidity and current cash flow situation while providing you with a strong indication of how you can improve these metrics. Every situation is different, and a cash management dashboard can drive the optimization of processes handling accounts payable and accounts receivable. A cash management dashboard gives you a detailed overview of:
- Quick ratio
- Current ratio
- Cash balance
- Outstanding debts
Any cash management dashboard should examine your current ratio and your quick ratio. The current ratio identifies the liquidity of a company and its ability to pay off short-term debt, including accounts payable and other outstanding debt with its short-term assets (cash, inventory, receivables). This KPI is calculated as a ratio of current liabilities over current assets, informing a finance professional whether the company can pay off its debts at any time. If this ratio reaches less than 1, your firm cannot pay off its obligations. By tracking the current ratio, a financial dashboard ensures that business leaders keep a pulse on the solvency situation of a firm, allowing them to calculate burn rate and runaway with ease.
The quick ratio is another important liquidity metric that provides a more conservative overview of a firm's liquidity. The current ratio does not factor in inventory and other assets classified as an investment as short-term assets. If your current assets include a lot of less liquid assets, your quick ratio will be much lower than your current ratio. Similar to the current ratio, a quick ratio greater than 1 indicates that your business is able to pay the current liabilities without liquidating further assets.
A cash management dashboard should always include an immediate visualization of the most important balance sheet figures, including accounts payable/receivable. Including these figures in your cash management dashboard provides finance leaders with an overview of debts owed by customers, as well as debts the firm owns to suppliers, vendors, and creditors. Dashboard builders can decide to track accounts payable/receivable over the course of any period.
Profit and Loss
This type of finance dashboard example provides a comprehensive overview of a firm's income statement. These dashboards usually include:
- Revenue to net profit
- Enhanced by relevant performance ratios
A Profit and Loss dashboard should include four important financial indicators:
- Gross profit margin
- OPEX ratio
- Operating profit margin
- Net profit margin
Gross profit margin is a KPI that measures the profit a firm generates after subtracting the cost of goods sold, excluding taxes and interest. Subtracting the cost of goods sold shows the gross profit of your company and indicates the earnings after expenditures. OPEX measures a firm's operating costs or “unavoidable” costs. These expenses are incurred in every industry; however, businesses must still make an effort to understand them for every department, including sales, marketing, IT, and general expenses. The trends of a firm's earnings before interest and taxes (EBIT) are also important to include in a profit and loss dashboard since EBIT is one of the most telling figures of a firm's performance.
CFO
Our next dashboard template centers around financial executive leaders, or CFOs. These professionals usually focus on more technical financial metrics, but also expand into employee/customer satisfaction figures to provide context.
A relevant CFO dashboard should cover the following 4 metrics:
- Costs
- Sales goals
- Gross profit
- Customer and/or employee satisfaction levels
Integration with third-party connectors such as market indicators, investor information, cash management, and others may also be helpful to provide the CFO with as much technical analysis as possible. Most importantly, the following metrics should always be included when constructing a CFO dashboard:
- Revenue
- Gross profit
- EBIT
- Operating expenses
- Net income
By including these metrics, the CFO possesses a clear understanding of the firm's financial performance on a quarterly basis, with the option to analyze an underperforming metric more deeply. can have a clear overview of the financial performance on a daily, monthly, and quarterly basis. It is also possible to include industry or competitor benchmarks for these metrics, allowing the user to quickly compare a firm's performance.
Although CFO dashboards are heavily focused on technical indicators, satisfaction drives profit. If employees are satisfied with their workplace environment, they translate this satisfaction to higher work rates and better production. Similarly, if customer service is exemplary and consumers are appreciative of your product's contribution to their lives, a firm's profits will rise. Adding satisfaction metrics that measure trends on a monthly or quarterly basis can help a CFO gauge satisfaction and improve wherever necessary to raise them.
Marketing Performance
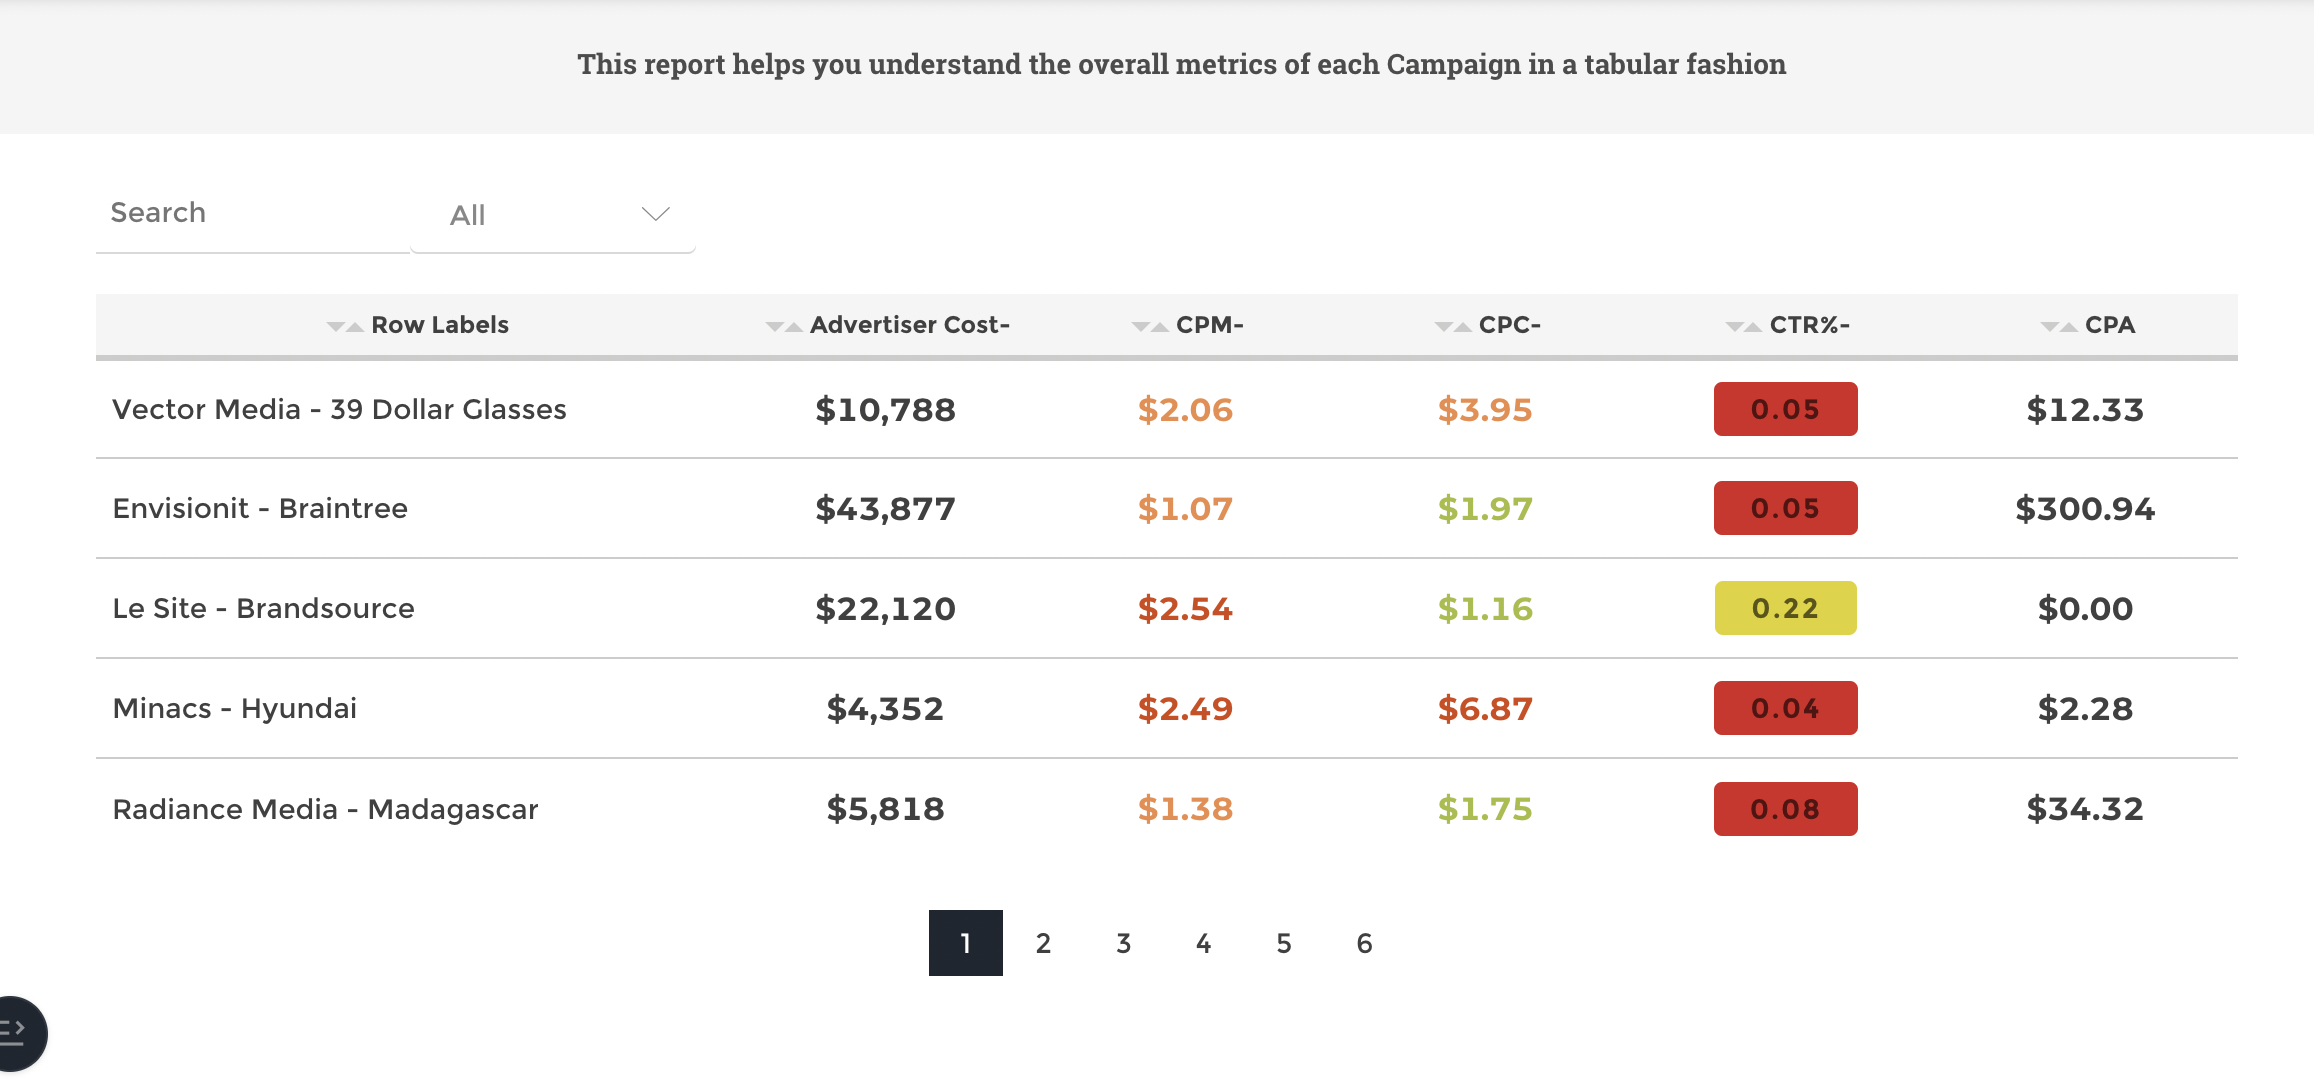
Marketing Performance Dashboards place a heavy focus on technical marketing indicators. Now, more than ever, firms are placing an emphasis on efficient market budgeting to ensure that financial resources are efficiently distributed across other channels. These are the four main areas that Marketing Performance Dashboards address:
- Total Ad Spending
- Revenue
- Total Transactions
- ROI
Advertising is a science. Marketing leaders are expected to have the expertise and insights available to them to correctly manage an advertising budget and produce results. It is crucial for marketing and budget leaders to measure ad spending and the results they are producing. Tracking revenue directly attributed to ad spending or marketing traffic can indicate a firm's marketing efficiency. Marketing departments whose ROI is less than 1 should revaluate their strategy to ensure that resources are preserved.
The financial Dashboard Solution
Business owners in any industry or company size can introduce data analytics to increase efficiency in all departments. Whether in sales, marketing, or finance, budgetary constraints play a major role in a business's operations. Tracking metrics for every department and ensuring that the business is financially healthy in all areas can drastically reduce the risk of default or capital mismanagement. Data visualization tools provide the best possible solution for tracking these figures and updating KPIs in real-time.
Toucan’s embedded analytics works to cater to specific use cases for several industries, carefully tailoring its applications to the requests and needs of a client. With rapid app deployment, Toucan’s real-time KPI tracking is extremely useful for businesses looking to keep constant tabs on financial health. Mobile optimization also caters to business owners on the move and simplifies complex data sets to tell a firm’s data story.
Embedded analytics to track finances is the way forward, with more business owners adopting its perks to track crucial metrics.
.png?width=112&height=112&name=portrait_agathe_face%20(1).png)
