One thing your organization won’t be short on is access to data and information when it comes to sales and revenue. But often this data is located across multiple sources and presented in formats that are difficult, if not impossible to understand and apply.
The solution? A sales dashboard. The problem? Not every team or individual needs access to the same type of information and a poorly configured or unsuitable dashboard will do little to solve your problems.
That’s where the Toucan Sales Dashboard can be a real game changer. It allows you to customize every aspect of the dashboard and present each user with the specific information and data that is most relevant to them.
So, to show you why a one-size-fits-all approach to setting up your sales dashboard might cause you problems, we’ve identified 4 clear use cases where customization will lead to greater efficiency.
But, before we get started, let’s go over some key principles for getting the most out of your sales dashboard.
Setting up your sales dashboard
The first thing to do when starting to use a sales dashboard is to define the goals for the platform. There’s a strong chance that multiple teams and profiles will be accessing the dashboard, so it’s crucial to gain an understanding of the information that they want to have access to and the ways in which they plan on using the dashboard.
For some, this might be as simple as tracking growth. For others, it might be a collaborative tool for preparing reports or a way of exploring key data into new revenue channels. We would suggest doing this before you choose your software provider, as your use cases and requirements could significantly impact which software is more suited to your use cases. At Toucan, we’re confident that our sales dashboard is fully customizable, but not every dashboard on the market is as powerful or adaptable.
Once you’ve identified these use cases, you next need to define the metrics and key performance indicators (KPIs) that are most relevant to each of these areas. Now, you won’t want to present each of these data sets in the same way, so, with the right sales dashboard, you should then be able to choose the format in which each metric will be presented (graph, chart, spreadsheet, etc.). The final step is to make it easy for each individual user to navigate these data sets by choosing how they can filter and search through information.
Following these steps will ensure that you have a customized sales dashboard that addresses your specific needs and allows you to get the most out of the tool. The use cases and specifications can vary pretty significantly, but, at Toucan, we consistently see four areas where our users want to group their data and adapt how it is analyzed and presented.
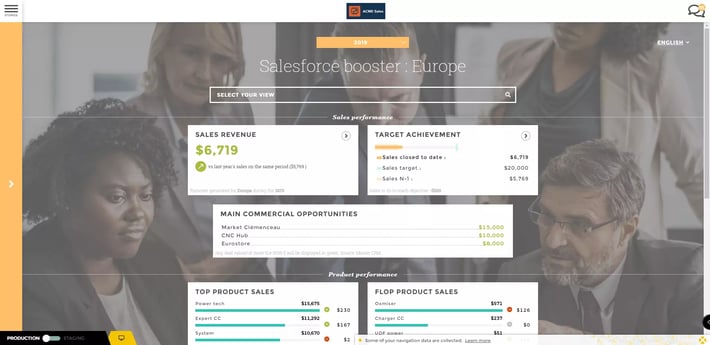
Revenue
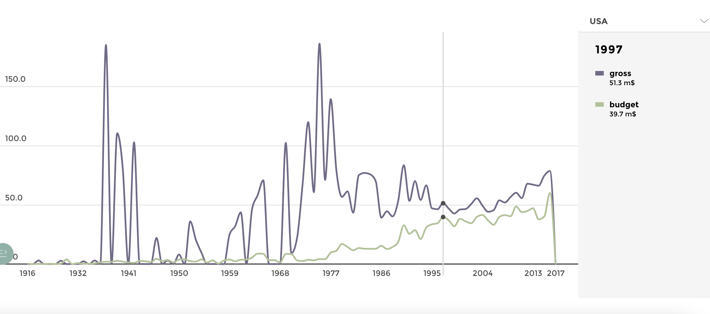
The first of these areas is an obvious one: revenue. No sales dashboard would be worth its salt if it didn’t help you to track and analyze your revenue, but knowing exactly what you want to get out of this section is still important.
Depending on your organization, you will want to have a global view of your revenues, but also be able to break revenue streams down by channel, product, geography, and any other number of variables.
The target audience of this information can also vary greatly. It will undoubtedly include Excom and senior executives, but it may stretch as far as your entire sales team or even your entire organization. So, make sure to pick a tool that allows you to change who gets access to what information through your sales dashboard.
As for the metrics? Most are fairly obvious and include things like ARR, MRR, and ARR bridge, but you also need a dashboard that allows you to filter these general metrics enough to easily identify key insights.
You’ll want to be able to break these metrics down by month, year, product, type of service, location, and more.
While a lot of this may seem simple, we often see sales dashboards that, even when they’ve been properly configured, are then too limited to allow for proper filtering and presentation of data.
Pipeline
Monitoring your pipeline is another obvious application for your sales dashboard, but it will still require some configuration. If set up properly, it will allow your sales managers and people to monitor your leads and deals and have a better understanding of your funnel and sales cycle.
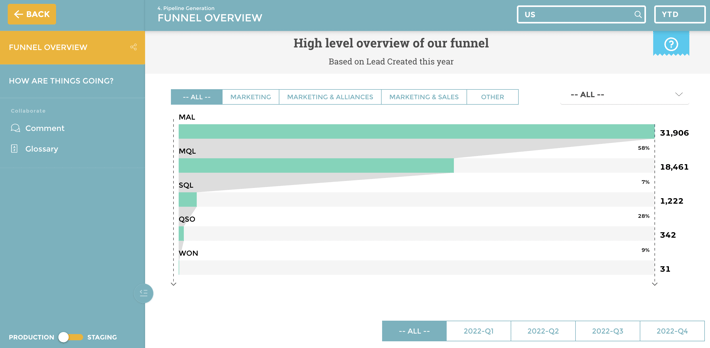
The right dashboard will allow you to easily access information like the most valuable open opportunities, progress on MQLs, and QSOs without planned activities. But more than that, it can be customized so that each individual user gets access to personalized and is presented information in a way that is more relevant to them.
Bookings
Related to your pipeline, creating a unique bookings section will help your sales managers and teams to keep a better eye on ongoing opportunities and have a better understanding of areas that require the most attention.
Here you can easily track sales cycle lengths, contract win rates, and deal size evolution. You should also allow your managers to filter by sales types (new business, cross-sell, upsell), by location, by product, and more.
Customer Base
Beyond incoming and ongoing deals, it is important that your sales dashboard also helps you understand what your existing client base looks like.
This can help your sales managers and teams, as well as several other departments within your organization, to gain a better understanding of what a typical customer looks like and how they use your product(s) or services.
This is the perfect area to track their individual ARR, their lifetime spend with your organization, customers that have churned, and other general details like your number of overall customers and prospects.
This data can be further empowered by the ability to filter by location or to be broken down by the specific products, services, or features that they use or pay for.
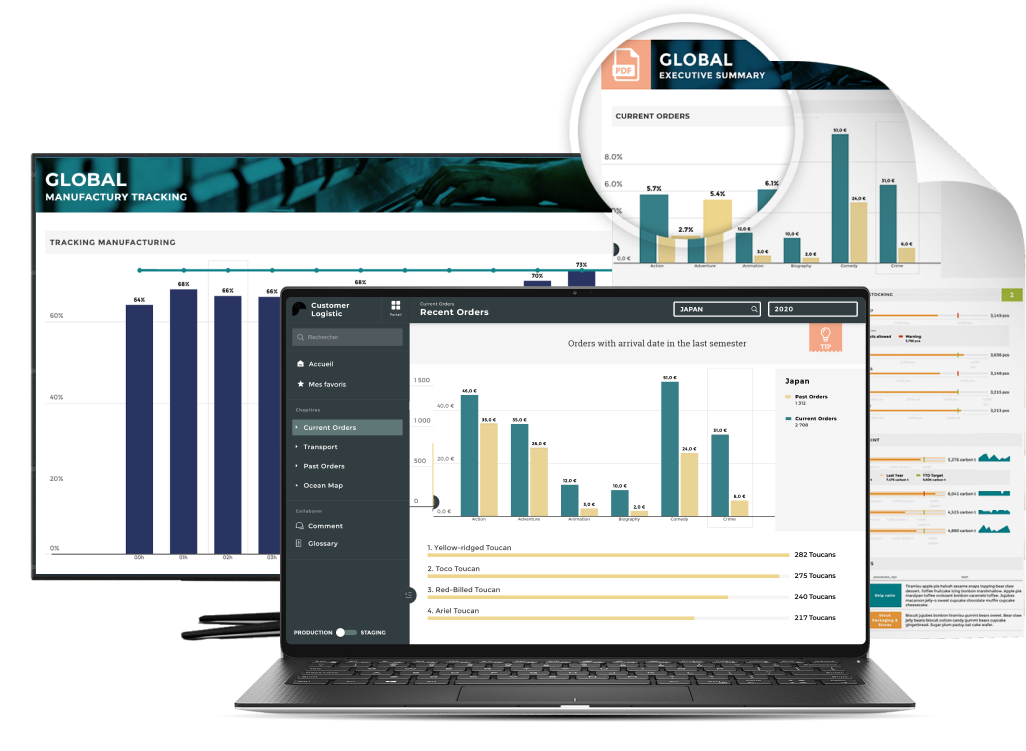
The Toucan Sales Dashboard
As you can see, even the simplest application of a sales dashboard requires some configuration. And sales dashboards can often fail or represent a poor return on investment because of an inability to connect your dashboard to all of your data sources, to properly adapt it to your specific organizational needs and use cases, or a lack of features that allow you to easily access that information in the right formats.
Toucan solves all of these problems by providing you with a fully customizable dashboard that has all of the features that you need to not only store and analyze your data but also present it in the formats that are most suitable for each intended audience.
Contact us to find out more about how the Toucan Sales Dashboard could not only help your sales team but also allow your entire organization to gain a better understanding of your sales process and revenue streams.