What is Occupancy Rate? Diving into a Crucial Real Estate KPI
Occupancy rate refers to the ratio of rented or used space to the total amount of available space. Put simply, it shows how much available space there is relative to space that is occupied (through leases, rentals, and the like) and helps analysts and business leaders to understand changes at both the market and property levels.
Occupancy rates are critical KPIs for a number of successful organizations, across industries and company sizes. They’re most commonly applied to the real estate and hotel industries, but can be contextualized in a number of ways analyzing anything from residential complexes, to hospital beds, to hotel rooms, to entire cities for macro-level analyses.
Regardless of the context, however, while the idea seems simple there is a LOT of nuance that must be understood to truly make use of this KPI.
In this page, we’ll dive deeper into the occupancy rate, covering what exactly it represents, how to calculate it, and why it's important if you want to be successfully data-driven.
How to calculate occupancy rates
Coming up with an occupancy rate, depending on the context, is generally quite straightforward.
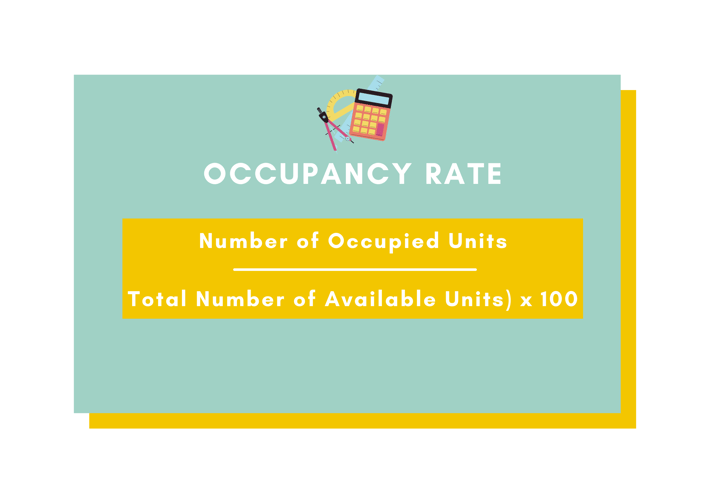
Let’s say you’re looking at an apartment building that has a total of 100 units. If 80 of those units have active renters, the building has an occupancy rate of 80%. The formula for calculating occupancy is, therefore, as follows:
Occupancy Rate = (Number of Occupied Units / Total Number of Available Units) x 100

Occupancy rates can be calculated for any time period that you wish to analyze by simply changing the figures in the formula to account for the time period that you’re looking at. Unsurprisingly, you can probably see by now that occupancy rates are relevant and connected with a number of other commonly seen KPIs, such as tenant turnover.
Why do occupancy rates matter?
Depending on, again, the context, occupancy rates are useful in a variety of ways.
They are very useful for real estate investors and managers because they are a strong indicator of anticipated cash flows and the financial health of a real estate project. For example, if you’re looking to invest in a shopping plaza that has a 10% occupancy rate (meaning tenants only lease a tenth of the available rental space) it’s unlikely that you’ll want to invest in that project.
Low occupancy rates mean investors or managers have to spend additional time and money to rent out the space, where the inability to do so would do nothing to remove the maintenance and tax expenses that are always present.
Occupancy rates are also indicative of the financial health of a particular area. For instance, if someone is looking to invest in something like a restaurant, they may elect to analyze the occupancy rates of surrounding hotels to understand whether this potential investment is located in a desirable area.
Generally speaking, one should aim to have a high occupancy rate (for reasons that are by now hopefully obvious). That being said, as with all KPIs it is important to use them in conjunction with other metrics as opposed to on their own. Your goal, afterall, is not only to have a high occupancy rate. It’s probably something like maximizing revenue.
What’s a “good” occupancy rate?
You might find the answer to this question frustrating: it depends.
Logically, you might think that a “100%” occupancy rate is what you should be aiming for. Yet while this is true, in many contexts, it’s not always the case.
Take hotels, for example. It’s now widely accepted that a 100% hotel occupancy rate often isn’t the most profitable operating model for these businesses. Instead,70-90% occupancy rates are frequently more successful. Let’s unpack this, because it’s not immediately obvious.
Imagine that every room in a hotel is booked. In this instance, you might be leaving some money on the table. You’re not able to sell additional rooms at higher rates in accordance with that demand. That’s an obvious issue; you likely want an occupancy rate that enables you to maximize revenue and minimize costs. This idea is especially relevant in luxury hotels where the guest experience is critical to success; more guests means more time (and money) spent providing that service.
Additionally, if your hotel is selling out every day with many advance bookings, you could probably charge more per room. And, as we mentioned, higher occupancy rates probably mean higher costs – if you have an occupancy rate of less than 100%, that’s fewer rooms to clean and (most likely) lower housekeeping-related costs.
Again, take this with a grain of salt. Generally speaking, other projects like commercial residencies typically want to see occupancy rates that are closer to 100%. This example is only intended to illustrate that you should contextualize this idea to your situation.
How to increase occupancy rates?
At Toucan, we’re experts in helping organizations become more data-driven with guided analytics that are made for everyday users. Not occupancy rates. So, while we don’t presume to be able to tell you how to do your job, there are a number of generally accepted strategies you can employ to increase occupancy (regardless of your business or industry). Here are some of them:
- Reduce your rates with things like special offers, incentives, or discounts
- Incentive longer stays (whether for leases or hotel rentals)
- Invest in marketing, though the actual marketing channels you employ will depend on your context
- Partner with referral agencies, influencers, or the like
- Understand your ideal audience to target the types of people that are the best fit for your offering
If you want more tips on increasing occupancy rates, check out this article!
Analytics for occupancy rates
KPIs analyzed in isolation are more or less irrelevant. Yet with all the metrics that are out there, it’s difficult to make sense of your business without being a data expert.
Pretty much any professional working in today’s ecosystem needs holistic solutions that address the critical issues of their industry. That means having the right information, at the right time, in the right context. This is where analytics tools that make the most of key KPIs, like occupancy rates, come in.
We must ask ourselves several questions to make the most of our data, including:
- How can we improve the readability of the data we’re collecting?
- How can we share our business’s information with the people that need it most, where and when they need it?
- How can we merge complex multi-source data coming from our teams, locations etc., and how can it be analyzed to drive more optimal decision making?
- How can we create simple, interactive, and actionable dashboards quickly and efficiently?
Fortunately for us, the answers to these questions becoming simpler and simpler with guided analytics tools.


