Enterprise Value-to-Revenue: All You Need to Know
Enterprise value to revenue (EV/R) measures a firm’s revenues to its enterprise value. Oftentimes, firms looking to price acquisitions. Paired with NOPAT and EBIT, EV/R serves to uncover a firm’s actual value that can be muddled when looking at balance sheets full of debt and levered funds.
For bigger firms that are publicly traded, financial analysts utilize the enterprise value to revenue ratio to compare the stock price to a firm’s revenue.
EV/R is often expressed as a valuation multiple and is an important indicator because, unlike NOPAT, it adds debt and extracts cash, which an acquiring firm would need to take on after a merger or acquisition.
How to Calculate Enterprise-Value-to-Revenue Multiple
A firm’s EV/R can be calculated by taking the enterprise value of a company and dividing it by the company’s revenue.

Enterprise Value = MC + D - CC
- MC: Market Capitalization
- D: Debt
- CC: Cash and Cash Equivalents
How to Use Enterprise Value-to-Revenue Multiple
Let’s use a firm that has $150 million worth in assets, with 20% of them being cash. This same firm also has $40 million in short-term liabilities and $60 million in long-term liabilities. 20 million shares of the company’s common stock are outstanding at a price of $18, with the firm reporting $90 million in yearly revenue.
Using the formula, the EV of the firm is:
EV= (20,000,000 x $18)
+ ($40,000,000 + $60,000,000)
- ($150,000,000 * 0.2)
= $360,000,000 + $100,000,000 - $30,000,000
= $430,000,000
Next take the EV and plug it into the EV/R ratio formula:
EV/R = $430,000,000 / 90,000,000
= 4.7
Although enterprise value can be calculated using a more expansive formula that includes more variables, analysts most prefer this simplified formula to keep a more uniform comparison across firms.
Limitations of EV/R
Because enterprise value-to-revenue is used to compare companies in the same industry, it is difficult to know which company is really the best in the industry.

If benchmarked against a poorly performing firm, the acquiring firm may have a difficult time differentiating a good EV/R from a bad one.
EV/R also requires more intensive calculations, especially when using more expansive iterations. Unlike market cap, which is readily available everywhere, calculating EV/R for every competing in an industry firm is time-consuming. However, this effort could provide valuable insights and prospects for future acquisitions.
Tracking EV/R
As a more intensive indicator, EV/R requires the additional tools to track effectively. With adoption growing for embedded analytics tools, firms are vying for success driven by precision, ownership of their data, and actionable insights.
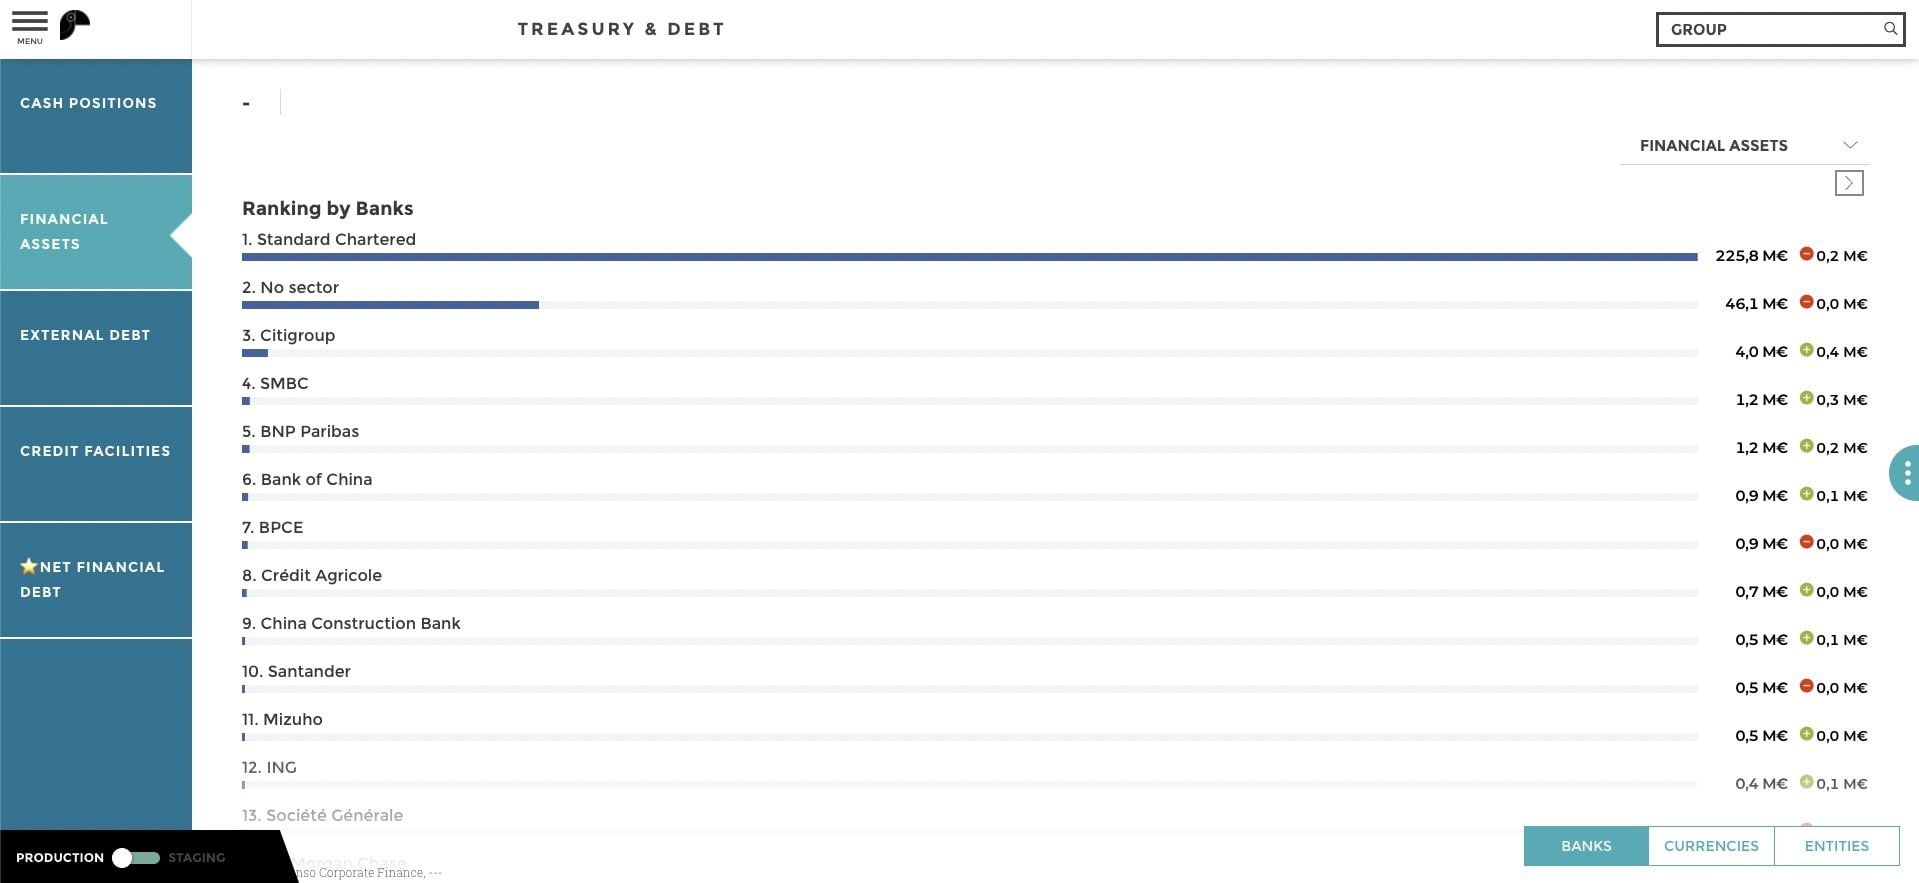
An example of a data visualization tool includes Toucan, which can serve as a finance professional’s secret weapon. With added functionalities of embedded glossary pages, mobile device optimization, in-app collaboration, and stunning dashboards, data visualization tools provide a simpler, more effective ownership of financial data.


