


Personalizing the customer experience is a key element of the current retail landscape. This presents significant organizational challenges for decision-makers, which can limit data sharing and lead to teams working in silos. Decision makers need to have access to a company dashboard to help them manage their stores and keep track of performance and customer knowledge data.

Challenges faced by retailers
40% of marketing managers have stated that they don’t have the skills necessary to use customer data as effectively as possible.
The digitalization of retail means that a large quantity of data needs to be available for use, including information on products, customer behaviour, conversion rates, and store locations and performance.
There also needs to be a centralized place to store all of this data, so it can be consulted easily during the decision-making process.
Which indicators do you need?
The retail market is becoming increasingly complex, meaning that companies need to manage ever-growing quantities of information.
Effective reporting is paramount: it is essential to have a dashboard that will give managers, salespeople and other stakeholders daily access to the data they need, even offline.
It is also important to choose the right KPIS. In the retail sector, having access to an overview of sales activity, with both short and long-term data, is key.
An effective dashboard offers your company the opportunity to make significant improvements in various different areas, by providing detailed data on :
Your customers: better customer knowledge means improved targeting.
Your market: more comprehensive knowledge of the market and products, with a clear perspective on the different channels and markets in which your brand is present, as well as more detailed comparisons with competitors.
Your performance: your sales team can clearly see the opportunities available to them, leading to improvements in the team’s performance, as well as greater profitability for the company, an increase in revenue streams and reduced costs and losses.
Example of a retail dashboard
On the homepage of this retail dashboard, you can see a detailed overview of the company’s activity.
Various different types of data are displayed :
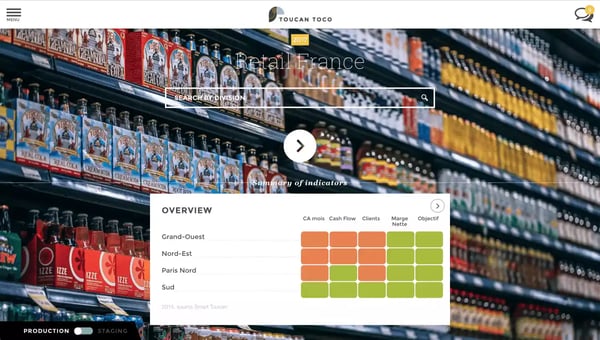
An overview of different markets, sorted by geographical area, with information on sales turnover, cash flow, customers, profitability, and whether or not goals have been achieved.
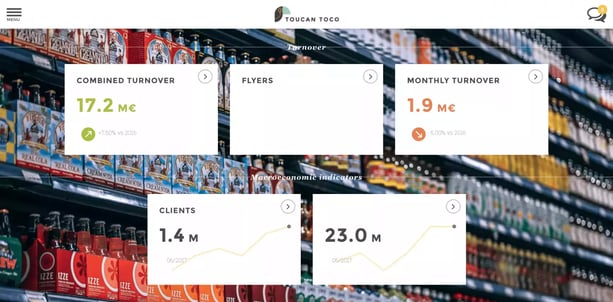
You can also see a detailed perspective on combined and monthly turnover, as well as sales performance indicators.
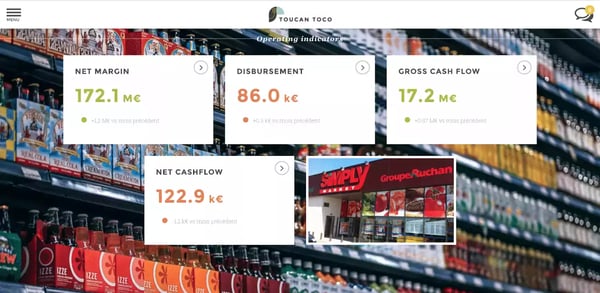
Lastly, several operating indicators are displayed, including net margin, disbursement and cash flow.
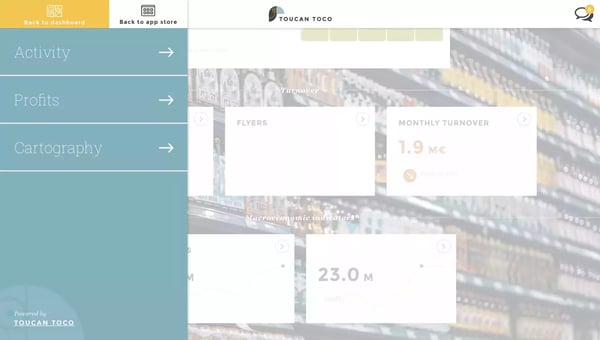
The dashboard has three sections : activity, profits and cartography.
ACTIVITY – SALES INDICATORS
In the Activity section, you first see a short-term (monthly) view of sales performance.
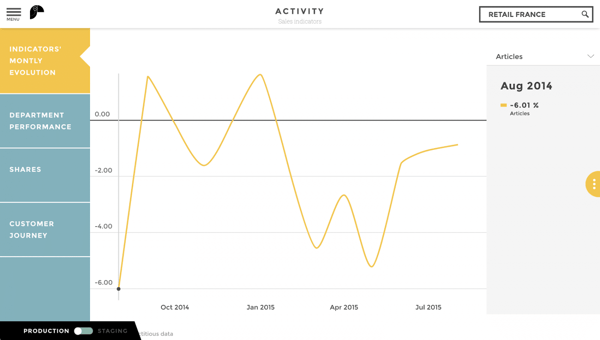
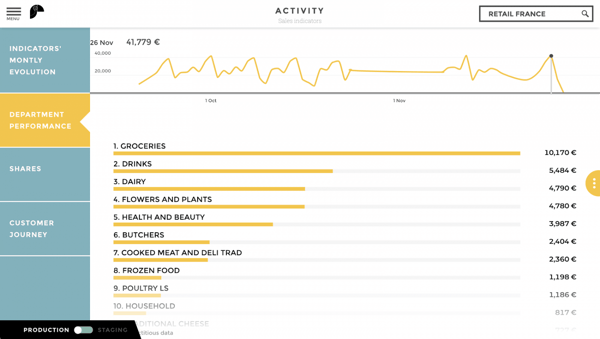
You can also see how different types of products, such as drinks, groceries and flowers, have performed over the course of a month, along with the associated revenue data.
Finally, this section offers a detailed look at the customer journey, which can help improve conversion rates.
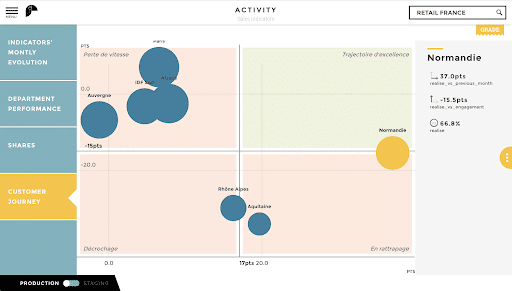
You can also consult performance indicators, shown by geographical area : performance results compared to the previous month, as well as whether or not sales turnover goals have been achieved.
ACTIVITY – STORES AND GEOGRAPHICAL AREAS
This section enables you to evaluate the progress that has been made, view rankings that show the performance of different stores, and a take a look at goals that have been set for different geographical areas.
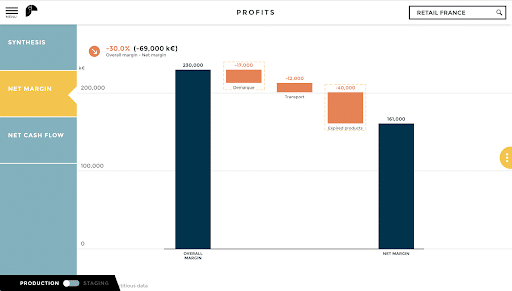
PROFITS
In the profits section, you can see a synthesis of the data, as well as information on the net margin and net cash flow.
The net margin enables you to evaluate the company’s profitability.
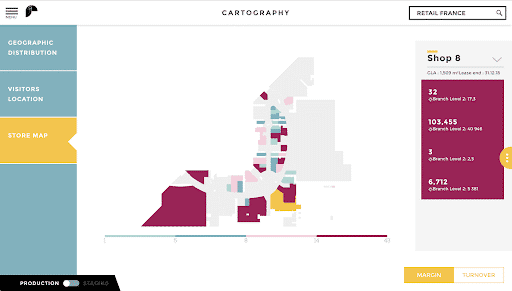
CARTOGRAPHY
The cartography section shows where stores are located in a given region. You can also see where your clients are located, and consult a detailed map of the stores.
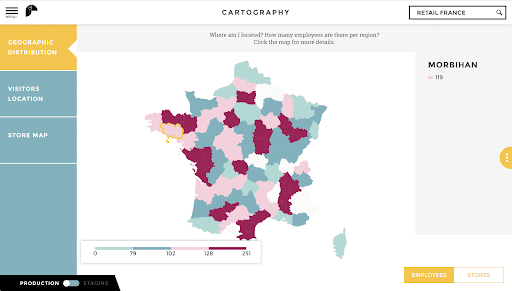
Here we can see a map of Metropolitan France, showing the number of stores and employees in each region.
The detailed store map offers information on the length of the store’s lease, the cost of rent, and profitability per square meter.
Key points on retail reporting
This retail dashboard offers a wide range of different indicators.
It is important to use a steering tool that is well-adapted to the data you are working with, as well as the various different sources of this data.
A dashboard facilitates both internal and external communications, making it quicker and easier to share information. Your reporting is also accessible from anywhere, even offline. This tool makes it easy to know which decisions to make in order to improve your company’s performance, growth and competitiveness.

