Use Data Storytelling to Create Your CFO Dashboard
.png?width=88&height=88&name=portrait_agathe_face%20(1).png)
Agathe Huez
Publié le 19.08.22
Mis à jour le 13.01.26
3 min
Résumer cet article avec :
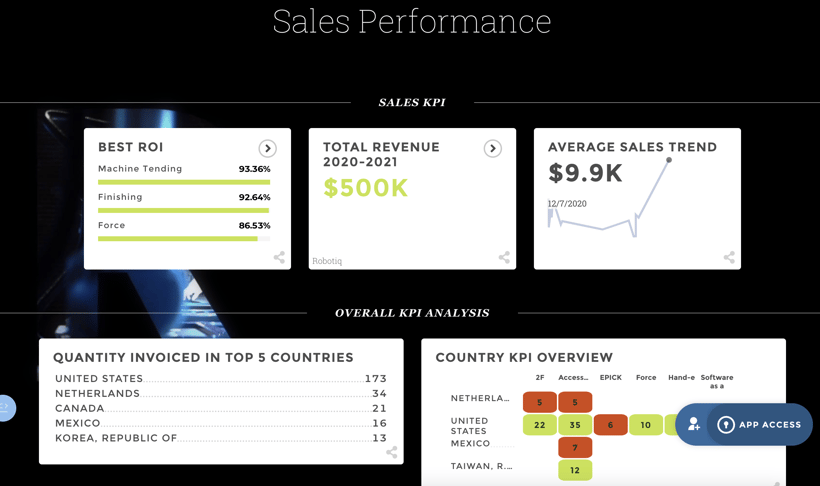
Meet Mark. Mark is a successful CFO at a mid-market retail company, leading his firm to sustained and consistent growth through his decision-making. As a CFO for over 10 years, Mark knows his company inside and out and has been relying on a mixture of instinct and advice from his team to implement changes.
For the first time in Mark's career, his company experienced a sharp downturn in 2020 due to the COVID-19 pandemic, sending the board into a panic. A 20% decrease in sales, leading to plummeting revenues and profits really hurt the company, and without funding, Mark's firm was bound to fail.
Because of the board's experience, the firm navigated the next 19 months of the pandemic to keep the company afloat, but with a recession looming, they worry about weathering yet another storm, since the company produces more expensive and higher quality clothing products, which are expendable in a recession scenario.
Most importantly, the firm's financial department is understaffed and technologically shorthanded, with the firm's data stack dwindling to save costs. Mark has been brainstorming to find a cost-effective method that will drive growth in both the short and long term.
This scenario is one that many CFOs find themselves in today. The COVID-19 pandemic hit the retail and hospitality segments, and current forecasts of a recession are beginning to drive consumers away from spending. Although many financial leaders are qualified enough to reach success with a mixture of gut instinct and experience, this is simply not enough when navigating such an adverse market.
CFOs need help. Data analytics has been around since the inception of the computer, but they have evolved to be able to tell stories of any kind, whether it be sales, finance, marketing, market research, etc.
The statistics agree with this general sentiment. According to a 2018 survey conducted by Accenture, 81% of finance professionals stated that data storytelling is an essential skill for finance professionals.
Data storytelling is an asset to any CFO looking to glean insights from their data stack. While cold and raw analytics can help in some cases, a neatly presented dashboard that describes your company's financial story can create a context for what problems are causing the most pain, allowing the author to resolve them as best as possible.
To create a data story that can be resolved, CFOs must commission their firm's IT departments to find a solution, and create that story using the data industry's best practices. Here are some of the most important tips and best practices when using data storytelling to create your CFO dashboard.
How to Use Data Storytelling in your CFO dashboard
Make Your Story Consistent And Worthwhile
Since finance is a result-driven field, it may be tempting to throw your best metrics at your dashboard and look to improve them even further. Your story must be based on a question that must be answered. For example, in Mark's case, that may be "How can we increase our gross profit?" or "What can we do to optimize our operating cash flow?" Your question must be pointed, focused, and relevant to solving the most pressing financial weaknesses.
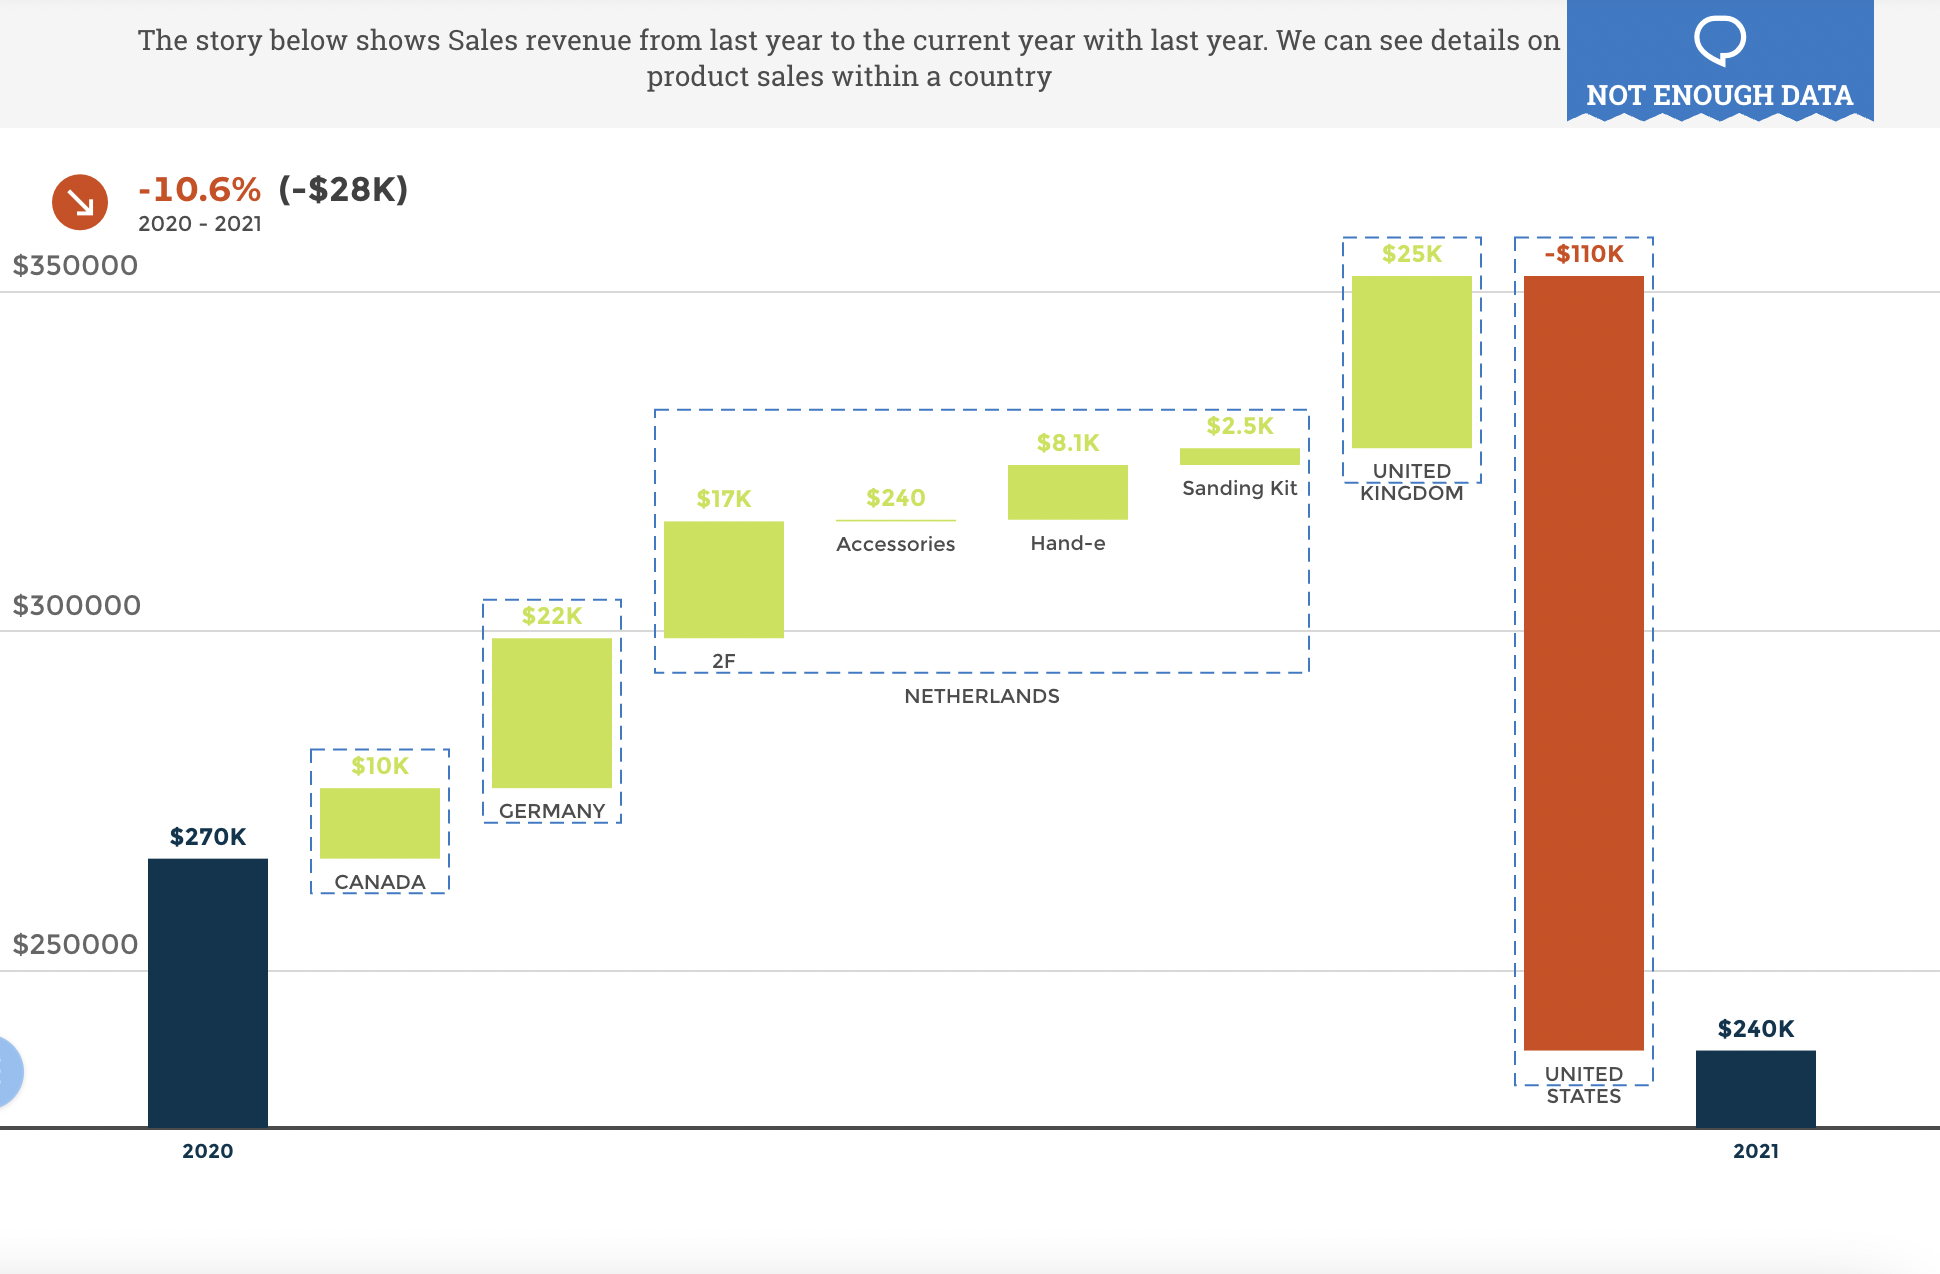
Once you have narrowed down the question(s) that you need to be answered, you must objectively select the best KPIs to tell your audience an objective story. Although a CFO dashboard is meant for decision-makers, it is likely that you will use it for quarterly reports and that a variety of audiences will view it. Your KPIs will be the events in your story, however, they must line up with the intended messaging that their author wants to convey. Keeping messaging at the forefront of dashboard creation is essential to uniting a firm toward answering your questions.
Research, Research, and Research
Whether you're a firm cutting down their data stack like Mark, or allocating a bigger budget towards BI and embedded analytics, research is the driving force behind telling your data story. Although your dashboard will automatically update with real-time data, running through the prototyping process takes effort and patience. Research each of these crucial areas:
- Embedded analytics solutions for your use cases
- The KPIs needed to answer your question
- Any additional questions that key stakeholders may want answered in your dashboard
By researching all aspects of your dashboard and conducting the prototyping process, your dashboard will answer your team's financial questions more effectively.
Design is Key
Let's say Mark did his research, selected the recommended embedded analytics provider recommended to him by his IT department, and is ready to begin designing his first dashboard. Mark wants all of his necessary KPIs, and he wants 13 displayed.
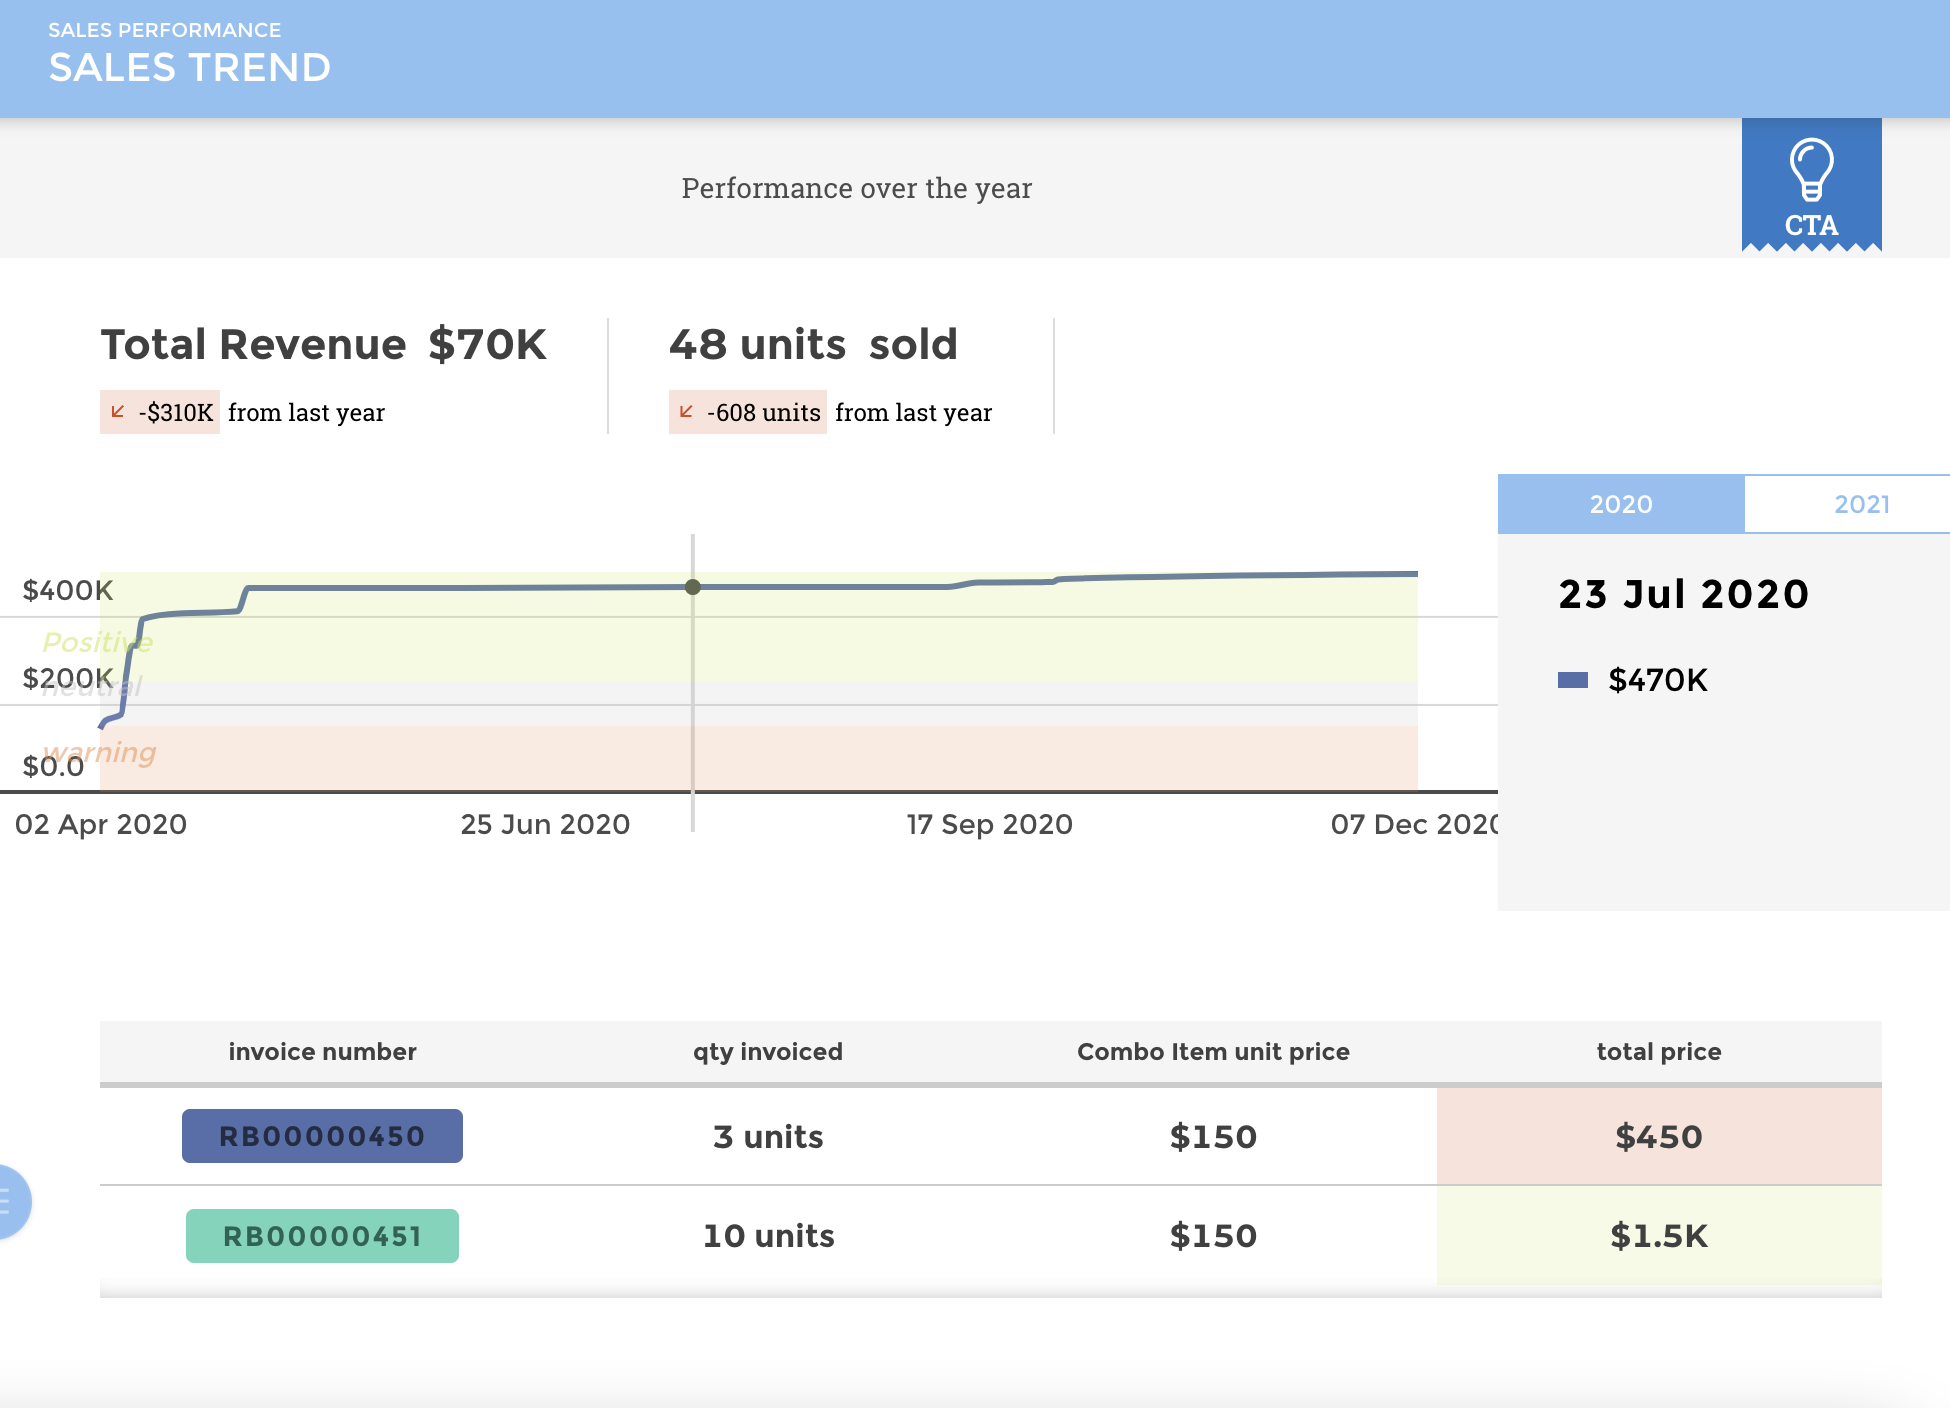
Presentation and delivery are essential aspects of storytelling, and the same applies to a data story. Little does Mark know, 13 KPIs on the same dashboard will deliver a result that involves confusion, clutter, and frustration.
Understand the aspects of your dashboard's design before you finalize a prototype. Here is a preliminary list of things to address about dashboard design:
- Charts and graphs
- Alignment
- KPI placement
- Logos
- Font and font size
- Legend and glossary
This is just a rough list of considerations when designing a dashboard conducive to data storytelling. If you're interested in learning more about the dashboard building process in more depth, read our guide on the topic.
Personalize Your Dashboard
When choosing a solution, Mark is given the comparisons of each tool and the recommendation. Because he wants a tool that can be used throughout the company for greater visibility, it is important to him that his employees actually want to see his data stories. After all, what good is a story if nobody wants to hear it?
Getting your team on board when investing in a data storytelling tool is the difference between success and money down the drain. By choosing a dashboard solution that makes your financial data look less intimidating, CFOs will be much better equipped to transmit insights to his or her team.
.png?width=112&height=112&name=portrait_agathe_face%20(1).png)
Agathe Huez
Agathe is Head of Brand & Communication at Toucan, with over 10 years of experience in marketing, branding, and corporate communication, particularly in the SaaS and tech B2B sectors. An expert in brand strategy, storytelling, and public relations, Agathe helps businesses give meaning to their communication and showcase their expertise to clients and partners. She plays a key role in growing Toucan’s visibility and positioning as a leading embedded analytics solution, both in France and internationally. On Toucan’s blog, she shares insights on how to build impactful B2B brands, create memorable experiences, and turn data into a true competitive advantage.
Voir tous les articles

