In this edition of ”Feature or Friction”, we will be examining Sisense. Sisense is a major player in the analytics industry with multiple great product offerings. But their claim of simplifying analytics got us thinking, how many of their features are actually a hindrance to users in obtaining actionable insights from their data. How much data friction does Sisense really have?
For a more general overview of Sisense, check out this article. Now let's get into the specific functionality of Sisense’s analytics solution and see if it is a feature or friction for the users.

-
ElastiCube
Result: FRICTION
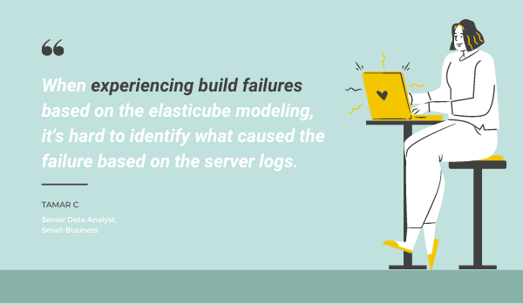
A Sisense-only technology they often publicize is a columnar database that can handle terabytes of data coming from disparate sources but requires minimal technical knowledge — the “ElastiCube”. What they fail to mention is that Elasticubes stop you from creating columns, new data fields, on the fly. To create a new column, it first has to be designed in the cube and then the cube itself must be rebuilt. Doesn’t sound too bad... Well, the catch is only the admins have access to editing the cube. Since admin controls also deal with data governance and system security, not everyone can be given access.
So to put it simply, while using Elasticube, the analytics designers have to create a ticket for the admin every time they want to add a new column. Delaying and complicating the process. This is the very definition of data friction.
-
Sisense Widgets
Result: FRICTION
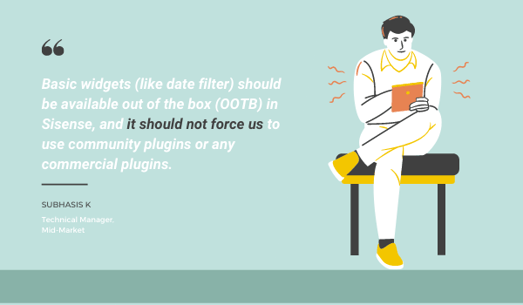
Widgets in Sisense are a great way to add additional features in your analytics solutions. It is a simple way of connecting another piece of code to get more customization in the visualizations that you are building. So, what kind of customizations, you may ask? Often, the “additional features” you need to add via Widgets are all of the basic functionality that Sisense is missing — stuff like data filters and white labeling.
Commonly used features should be standard. Included. Built-in. Like they are with almost every other analytics solution on the market. Not with Sisense. Making users go through multiple extra steps to get basic analytics features seems like an unforgivable form of data friction.
-
Fully-customizable
Result: FRICTION for non-technical users, FEATURE for developers
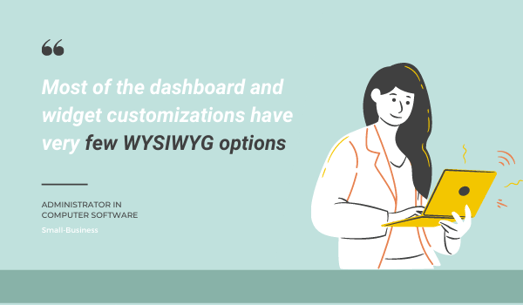
Sisense’s analytics offering is fully customizable — if you are a coding expert. Quite a few of the pre-existing dashboards are static. While trying to customize your dashboards, you find that none of them have WYSIWYG options. WYSIWYG, in coding terms, is the representation of text on screen in a form exactly corresponding to its appearance to the end-user. This means the coding for customizing dashboards needs to be done in the dark, with no idea of the final output.
Making customization in Sisense might be nearly impossible for non-technical users, but it is hard even for those with coding experience. This is the definition of data friction.
-
End-to-end governance
Result: FRICTION
Governance in every step of your analytics from start to finish sounds ideal. But with Sisense, their implementation seriously hampers the effectiveness of this governance. Each folder or dashboard is assigned to a single owner. That particular user has complete ownership of that folder or dashboard. They — and only they — determine who can and cannot access the data in it. What happens if the owner is away on vacation? Everyone is locked out of the data in the owner's module. What if the owner is removed without transferring the modules? Well, then the information is lost forever.
This seems like waiting for a data disaster to happen. There are much better ways of data governance than to have individual accountability for folders and dashboards. End-to-end governance, more like start-to-finish data friction.
-
Platform for all skill levels
Result: FRICTION for non-technical users, FEATURE for developers
Sisense is marketed as a platform for all skill levels. Given this, you might assume that anyone can use the analytics solution, irrespective of their technical skill level. And you’d be wrong. What Sisense really means is that their analytics solution has functionalities that are highly technical, code first and certain functionalities are code-free.
This “have and have-nots” approach promotes a low adoption rate for non-technical users who must constantly rely on support to get the most basic information from the solution. A major aspect contributing to data friction.

-
Advanced Visualization
Result: FRICTION for non-technical users, FEATURE for developers
Many of the ”pre-built” visualizations in Sisense are, well, behind the standards of the industry. Don’t worry — you can use “advanced visualizations,” they say. The only catch is that you need to know Javascript, JSON, and JAQL at a minimum to be able to design advanced visualizations in Sisense. What if you have a small team and cannot have a dedicated designer, who with the skills needed might as well be a software developer? You are stuck with the pre-built basic solutions that simply underperform.
If building visualizations require the same skill level as building an entire analytics solution from scratch, well that's data friction right there.

-
Unique data experience
Result: FRICTION
How does Sisense make the data experience unique you ask? By introducing their own scripting language. This means you will have to learn a whole new way of obtaining, merging, manipulating and visualizing data, just to be able to use the Sisense analytics solution. The worst part, the language has a steep learning curve.
You signed up with Sisense to get insights from your data and ended up having to learn a whole new scripting language. Now that just seems crazy. Especially when you compare it to Toucan, where everything is intuitive. No learning new languages, 0-code environment, One-click customization and more. Check out Toucan for yourself.