


SQL Server Data Visualization: Top 4 tools with built-in connectors
.png?width=88&height=88&name=portrait_agathe_face%20(1).png)
Agathe Huez
Publié le 21.12.23
Mis à jour le 13.01.26
4 min
Harnessing the power of SQL Server data is critical for making informed decisions in today's fast-paced, data-driven world. Connecting SQL Server to third-party tools for effective data visualization can be challenging. The primary objective is seamlessly integrating databases with external applications with optimized data integrity and security. In addition, you want to be able to create visually appealing and informative visualizations. The objective is also the challenge–finding a user-friendly tool to deliver your desired results without compromising your data. We have selected 5 SQL server data visualization tools to help you find the best tool to meet your needs.
Our selection of the top 5 SQL server data visualization tools is guided by key criteria, including:
- User-friendly connectivity with SQL Server.
- Who each tool is made for, understanding different scenarios, demands different solutions. We also focus on non-technical users who need intuitive interfaces when considering who each tool is made for.
- Data-level requirements address the expertise required to understand the data. We use examples catering to those with less experience.
- What is the tool known for or specialized in? For example, customer-facing analytics vs. internal ad hoc reporting.
- Business model pricing, highlighting options with open-source software using subscription models.
This blog is meant to help you navigate through the complex world of data visualization tools as you decide which tool is right for your needs.
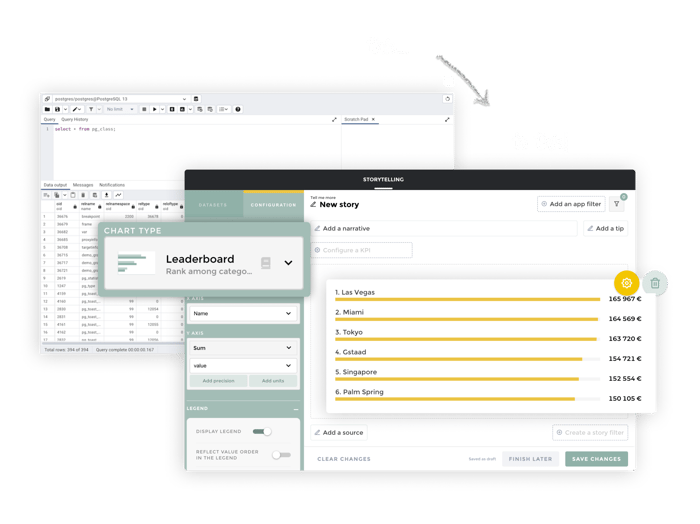
#1 Toucan | Customer-facing analytics and data storytelling

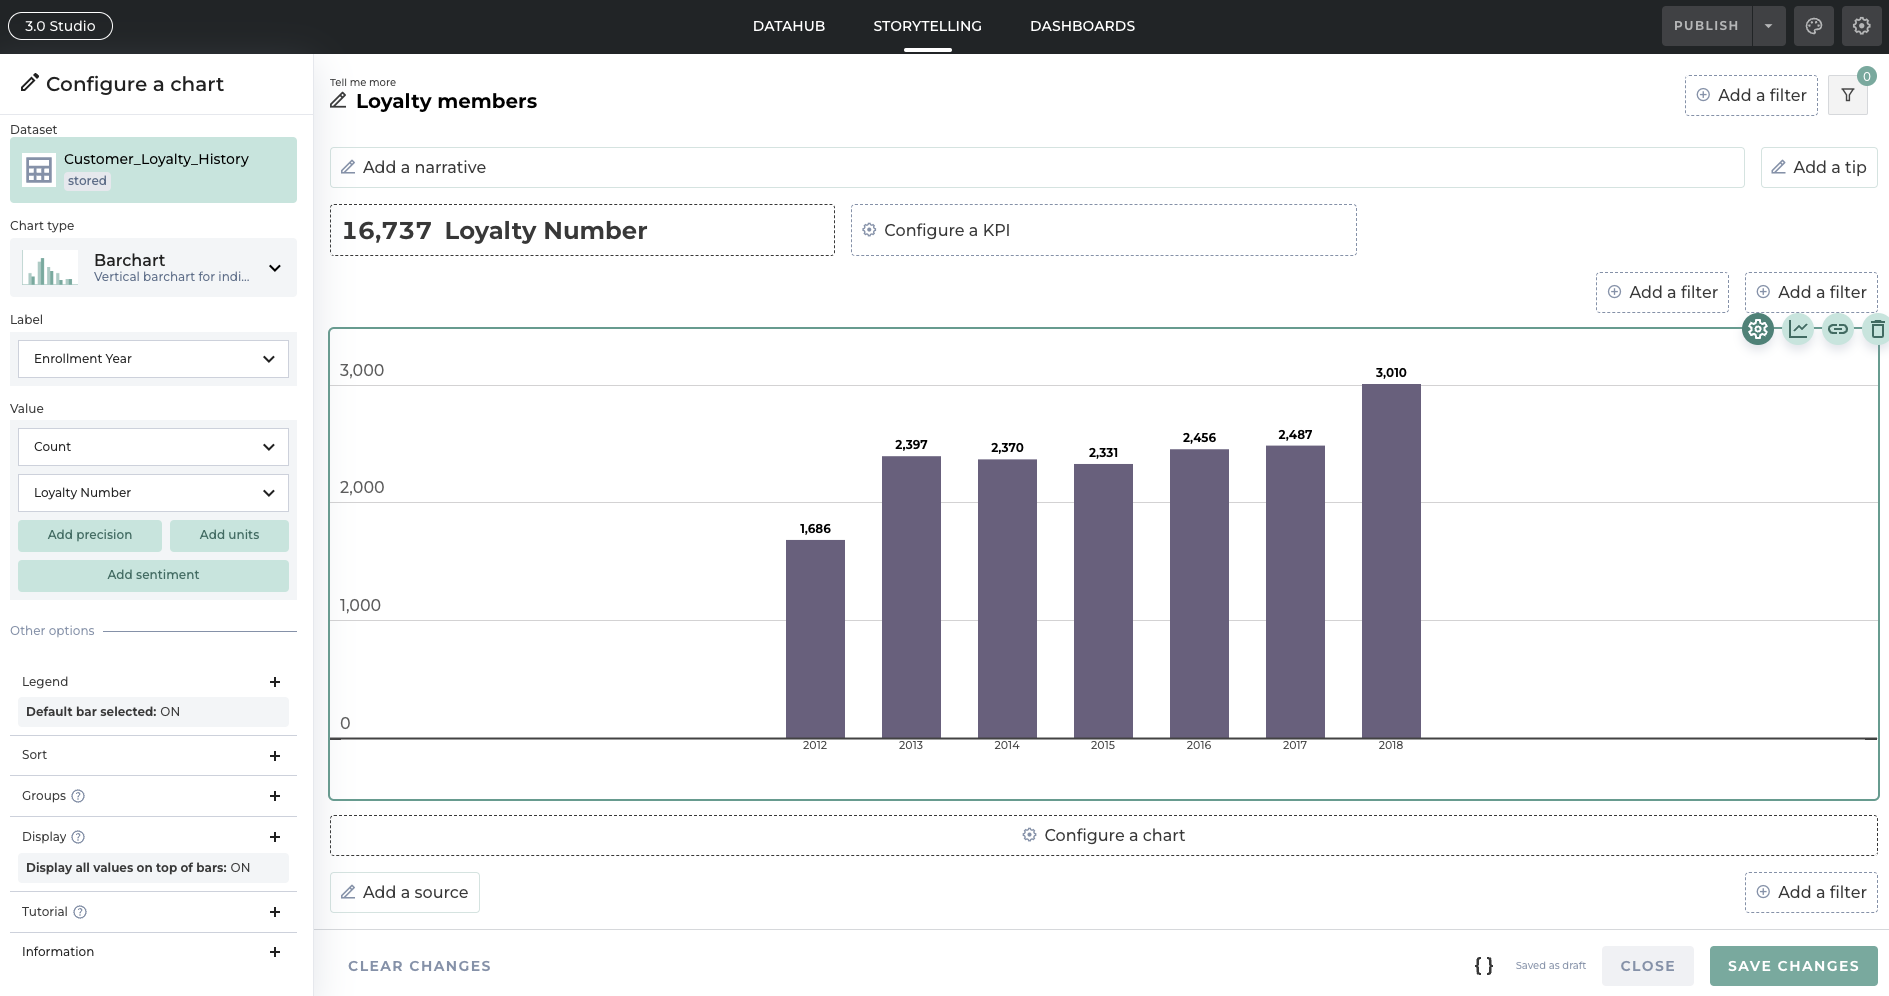
Toucan is specialized in customer-facing analytics. It is designed to transform complex data into engaging, easy-to-understand visual stories. The tool accomplishes compelling visualizations by providing a range of creative visualization options and targeting professionals in roles, including business analysts, marketing professionals, and customer success managers who need to effectively communicate data to their teams, clients, or other stakeholders. Toucan is a versatile tool offering valuable, understandable insights, capable of handling complex data sets and transforming information using data storytelling.
- Who it is made for: Product people, business analysts and analytics developers, and anyone interested in transforming data into effective visualizations.
- Data level needed: starting at intermediate level for creator, and anyone as an end-user
- Known for: A strong focus on storytelling with data.
- Business model: Subscription-based tiers.
Toucan provides a seamless connection to SQL Server databases. Integration is facilitated through Toucan's comprehensive suite of tools.
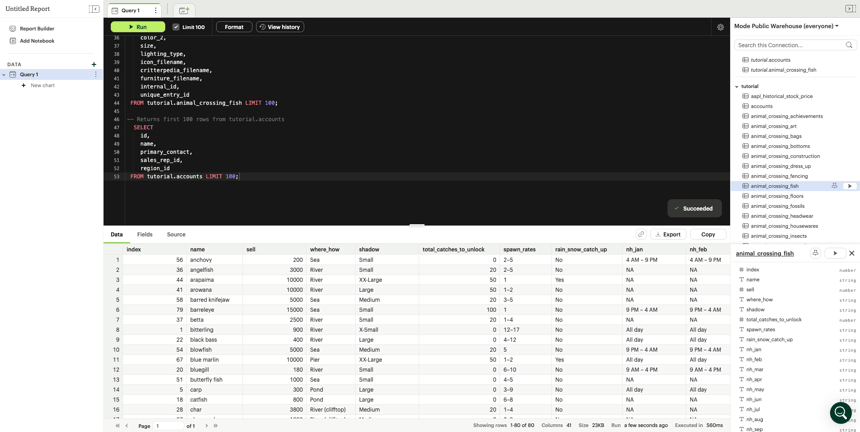
#2 Mode | Data exploration for advanced data teams

Mode is a comprehensive data analysis platform for users with an advanced understanding of data analysis. It has deep integration capabilities and a sophisticated environment for complex queries and in-depth data analysis. It is a scalable solution for any size team or large enterprise.
- Who it is made for: Mode is designed specifically for data scientists, analysts, and experienced data professionals.
- Data level needed: advanced
- Known for: Robust analytics and collaborative features.
- Business model: Subscription-based model with various tiers catering to different organizational needs.
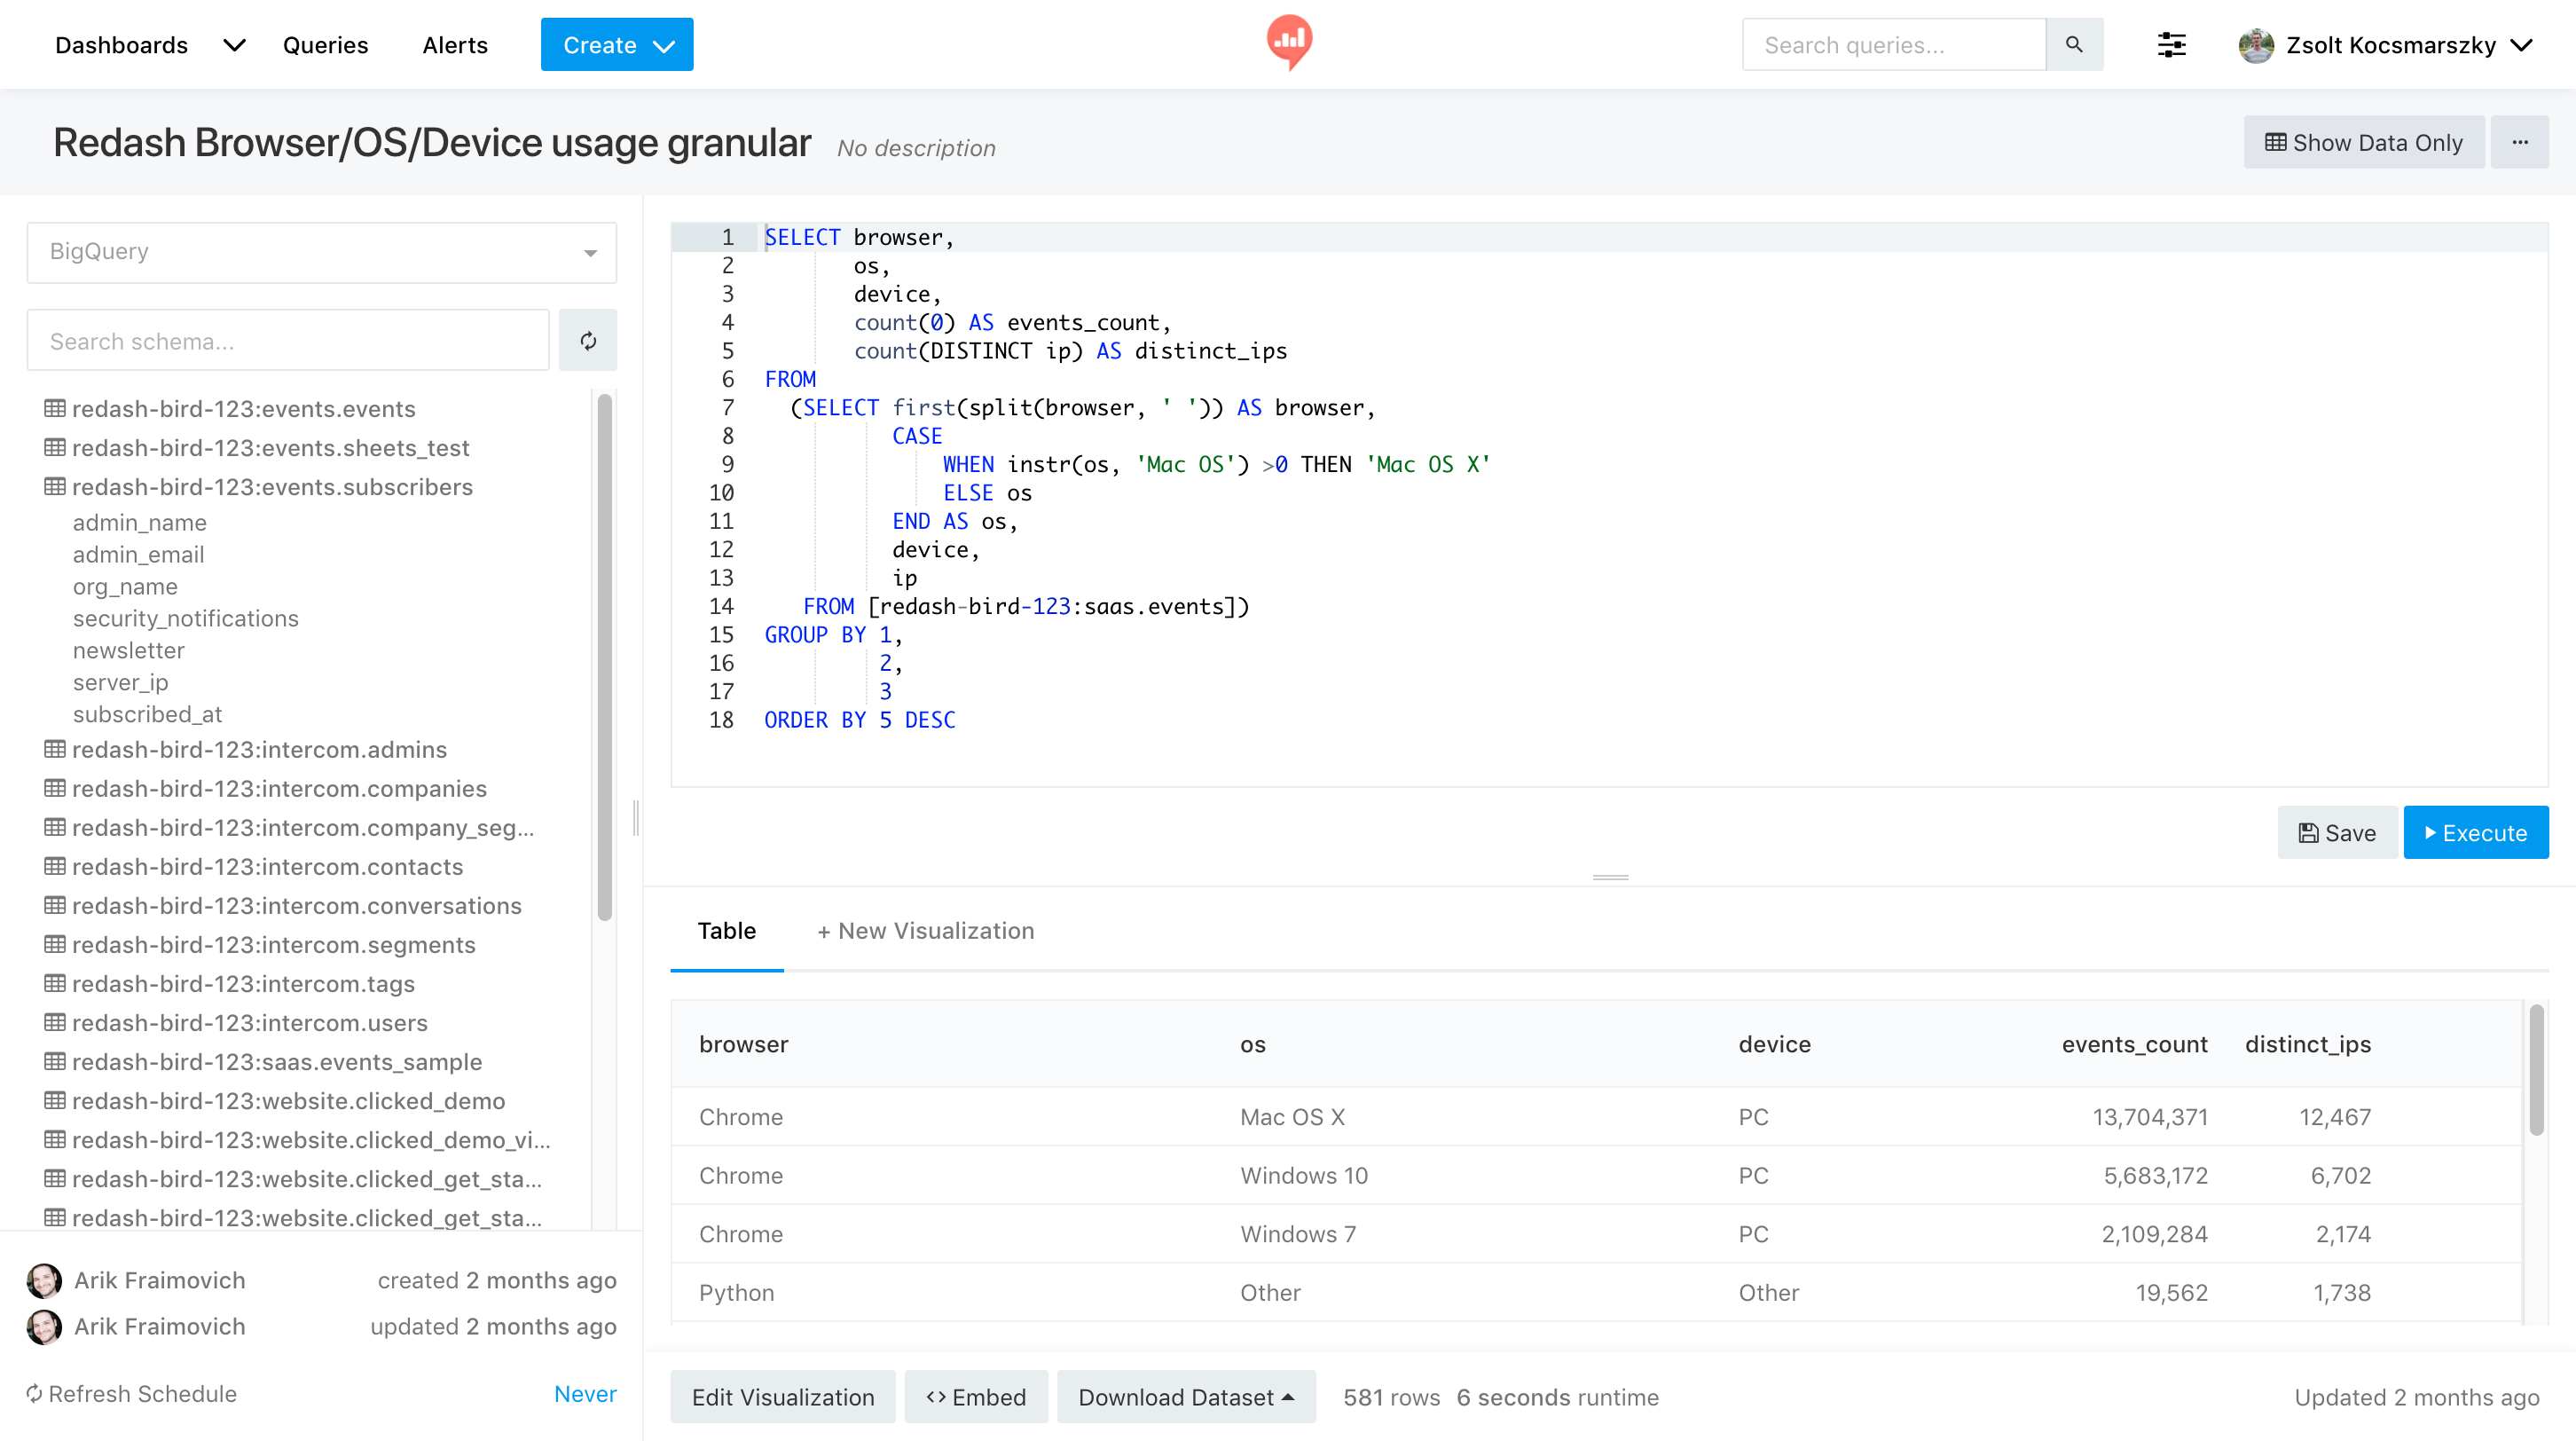
#3 Redash | Open source SQL notebook
Redash is a popular tool offering actionable insights from data. It is designed for data analysts, engineers, and those with advanced data proficiency. Anyone with a firm grasp of SQL and data analysis concepts can optimize the features using the Redash query editor and visualization tools. These tools allow for complex data queries and detailed analytical work using intuitive dashboards and collaborative features. Teams can access data visualizations through interactive dashboards and make informed decisions.
- Who it is made for: Redash is designed for data analysts, engineers, and professionals with intermediate experience.
- Data level needed: advanced.
- Known for: Intuitive dashboards and collaborative features.
- implementation: Dual approach, offering self-hosted, and a cloud-based managed service.
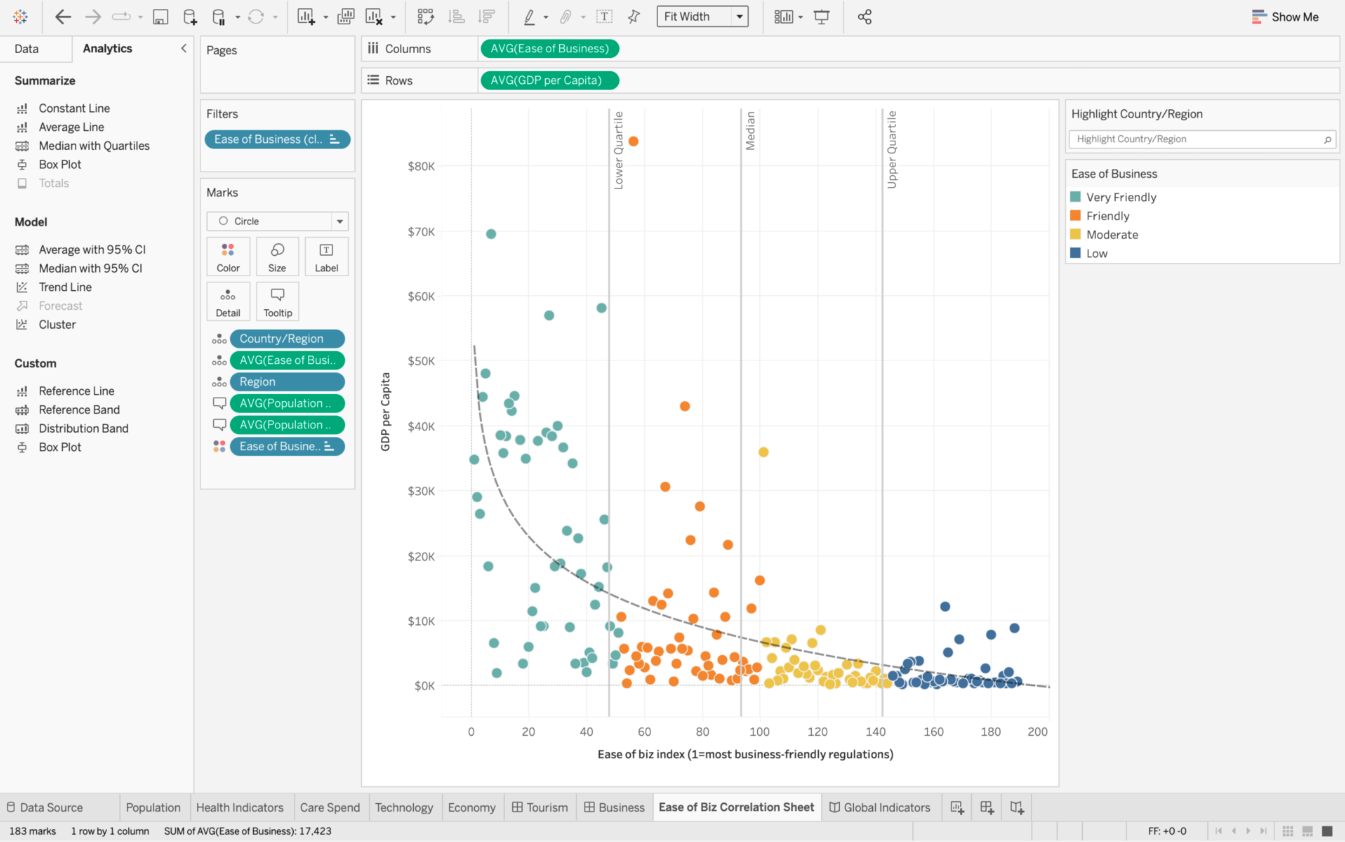
#4 Tableau | Business intelligence platform

Tableau is the most popular Business Intelligence (BI) platform. However, it doesn't suit every use case. It offers powerful exploration capabilities designed for data analysts and various data professionals. Catering advanced to expert users, Tableau has a complex interface that allows users to dig deep and create advanced visualization basic visualizations. For advanced user, you get a large selection of connectors built-in and multiple capabilities for data management, including data prep, data lineage, and data governance. However, Tableau does come with a higher price tag, starting at $900 per year for a single builder. While it aims to be the go-to tool for those seeking cross-source exploration, it's important to note that the web version can experience slower performance when it comes to joins, refreshes, and building dashboards. In comparison, the server option may seem somewhat outdated when compared to the latest tools on the market. However, attempting to accomplish such a diverse range of tasks does come at a price, and a learning curve. Be prepared for a challenge.
- Who it is made for: Data analysts and various levels of business professionals.
- Data level needed: intermediate to expert users.
- Known for: Data exploration and data visualization.
- Business model: Tiered subscription-based.
Tips for Choosing the Best Solution
Finding the best SQL server tools can significantly impact your business. Optimizing your data management and analytics capabilities will help you stay competitive in today's fast-paced digital landscape. Here are some tips to help you select the right tools to meet your business needs:
- Compatibility and Integration capabilities: Asses compatibility and integrations to ensure the tools integrate with your existing SQL environment and other data sources you use.
- User-friendly features: Evaluate the usability of the tool you are considering. Look for intuitive interfaces and features to accommodate the skill levels of your team. Tools that are inclusive of various skill levels ensure all team members can use the tool with minimal training.
- Scalability: Choosing a scalable tool is vital for business growth. The solution must be able to handle increasing data volumes and user demands without interfering with continued performance.
- Robust Security: Security is critical. Choose tools with strong data protection features like encryption, role-based access, and compliance with industry standards.
- Performance: analyze the tool's performance. It should be fast and reliable for small or large datasets. Optimal performance features include caching and optimized query performance.
- Customer Support and Community: Good customer support is essential for troubleshooting and user experience. Active user communities are also valuable assets for troubleshooting and sharing user tips.
- Pricing Model: choose a tool that has a pricing model that fits your budget. Analyze the cost relative to the features, including upfront costs and long-term expenses such as updates and maintenance.
- Read reviews and case studies: Read case studies and find non-affiliate reviews from users, especially those with businesses similar to yours.
Considering these factors can help you make informed decisions when selecting SQL server tools for your business. Find a tool that aligns with your organization's budget, needs, and long-term data strategy.
Conclusion
Utilizing the power of SQL server data is essential in making well-informed decisions in today's data-centric business landscape. Connecting MySQL databases to third-party tools for effective visualization can be challenging, but with the right tools, you can deliver actionable data insights everyone can understand. The key is to find an SQL server tool that integrates seamlessly with existing systems and offers user-friendly features for creating impactful visualizations.
With Toucan, you can not only create basic visualizations but also tell a story with your data, taking your team, customers, and stakeholders on a thought-provoking road to reaching innovative decisions for your business, ultimately helping you stand out in today's competitive marketplace. With customer-facing analytics, we turn complex data into engaging visual stories through a user-friendly interface. If you are looking for an SQL server tool to help you communicate data effectively, contact us today to learn how we can help you transform your data analysis process.
.png?width=112&height=112&name=portrait_agathe_face%20(1).png)
