


Types of Annual HR Report and Metrics to Include
.jpg?width=88&height=88&name=PORTRAIT_Baptiste%20(1).jpg)
Baptiste Jourdan
Publié le 26.12.22
Mis à jour le 13.01.26
7 min
An annual review of the performance of the business and the performance of the employees is required by the executive committee and the HR department. Each year, they prepare an HR report that provides a snapshot of their accomplishments and obstacles related to human resources.
The annual HR report provides an overview of the previous year's people strategy efforts as well as a roadmap for the coming year. It is, therefore, imperative that everyone in the organization team understands what should be included in a human resources annual report. Think about who you will be presenting to and what type of information will be most impactful.
The purpose of the annual HR report is that it:
- Ensures that human resources practices are aligned with the various KPIs or OKRs by providing a complete overview of the employees and company trends. Despite the fact that HR professionals typically provide weekly or monthly reports, an annual report provides an important overview for making long-term strategic decisions.
- Provides stakeholders with detailed insights into the organization that is not so obvious
- Analyzes the key initiatives and results of the past year
- Includes quantitative and qualitative information
- Allows HR to measure and track key workforce metrics and successes or failures
- Sets accurate, realistic goals for the following year
- Establish a qualitative retrospective that enables stakeholders to develop a follow-up plan.
Annual HR Report Templates and KPIs
In order to drive competitive strategies and determine if action needs to be taken in your HR environment to increase the dynamics of HR development, HR annual reports are an essential tool for companies to evaluate human resources activities each year. The following HR dashboards can be used as templates for annual monitoring purposes.
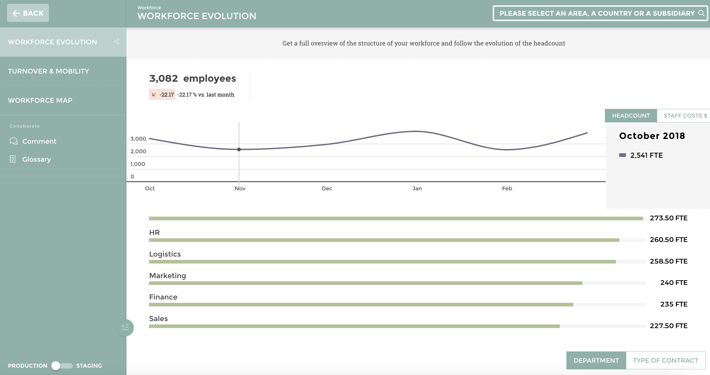
1. Employee Performance Dashboard
In addition to being integral to the ongoing success of your organization, your human resources department is tasked with helping motivate and optimize employee productivity on a continuous basis.
This HR report template provides a visual representation of key performance metrics, such as absenteeism, overtime, training costs, and overall employee productivity rates, across the organization. In turn, this employee management sample provides a wealth of information that can help you run your business as efficiently as possible. A variety of key elements of the workforce and its structure are discussed in this annual HR report example.
These are the KPIs linked to this particular template:
- Absenteeism rate: This KPI allows businesses to measure the level of employee engagement and is considered an important KPI since it indicates the level of motivation and engagement of employees with their work and the company as a whole. The organization should keep a close eye on this metric and strive to reduce the number in order to maximize productivity. To determine if employee absenteeism rates are unique to a particular department or if there is an issue that affects the entire organization, companies can determine the reasons for employee absenteeism over the past year.
- Overtime hours: This allows organizations to monitor employee workloads in greater detail and to identify employee dedication as well as flaws in the work process. Employee satisfaction levels can be affected by a permanent high workload, which can result in an increase in absenteeism rates. Having a high overtime rate can limit the company's growth potential and result in the loss of projects and orders.
- Training costs: Onboarding new hires and upgrading employee skill levels are measured using these metrics. In addition, it tracks the costs associated with employee development and the need for new skills. There is a wide range of training costs, including those associated with new hires and those associated with continuous education.
- Employee productivity: By dividing total sales by the number of employees, you can determine the effectiveness of your labor force. A number of factors contribute to the development of this metric, including the availability of employees and the number of hours they work, their performance, the number of products delivered, and the quality of saleable products produced during a specific period. Using productivity metrics, companies are able to understand employee performance and adjust their working processes as necessary.
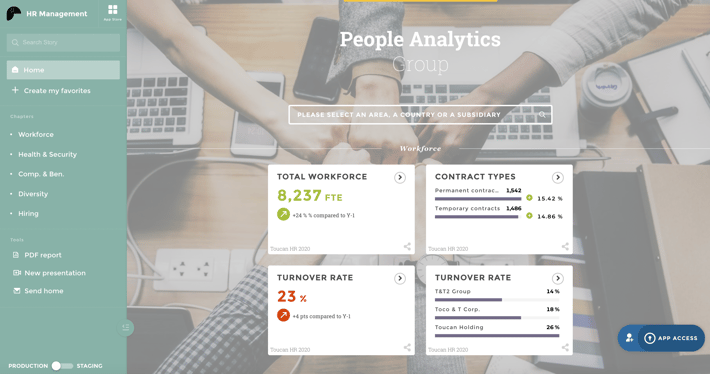
2. Annual Workforce Dashboard
Using smarter, more data-driven employee management, this sample HR report for management explores general workforce-related metrics that will help your business grow, evolve, and develop over time:
With the insights provided by in this HR annual report, you will be able to better engage your employees, reward good work, save costs in critical areas, and encourage employee loyalty - all of which are essential components of a successful organization.
Here are the primary KPIs associated with this example:
- Part-time employees: An indicator of the evolution of the part-time workforce over a defined time period. In the early stages of a company, part-time employees are ideal because they don't incur a great deal of risk. It is important to track part-time contracts in conjunction with metrics such as overall performance and results, as well as employee engagement and satisfaction.
- Female to male ratio: An indicator of gender bias is the level of gender diversity in your company. Diversity is crucial to acquiring new approaches to business innovation and gaining competitive advantages. A candidate's availability at certain times determines the KPIs.
- Internal mobility: An employee's internal mobility refers to any initiative or action pertaining to their promotion, appointment, or hiring for a position within the company. Various figures related to internal mobility are displayed in this internal mobility summary - promotions to the position of director and managing director, the ratio of positions filled internally versus the total number of positions, and finally, the percentage of internal vacancies filled.
- Average time stay: Determines how long employees stay with the company and whether the company is successful at retaining them. It measures the average number of weeks, months, or years that an employee remains with the company. In general, the longer the employee remains with the company, the greater the return on investment for hiring and training.
3. Annual Diversity Dashboard
A diversity dashboard can be generated annually with the help of modern BI dashboard software that provides fundamental indicators to assist HR managers in ensuring the organization hires a diverse workforce and provides them with equal opportunity.
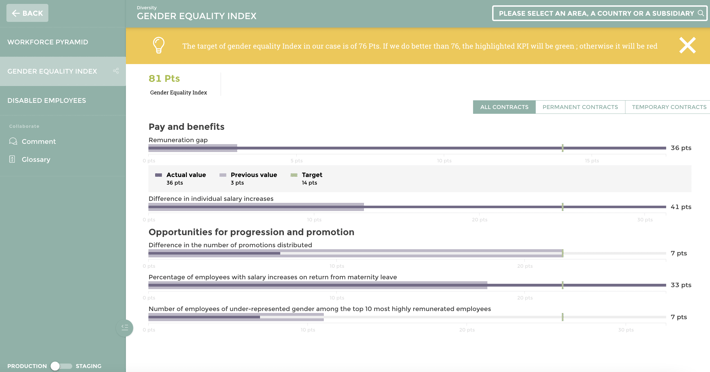
The value of bringing together people from diverse perspectives and backgrounds is becoming increasingly apparent to more and more organizations every day. However, even though a diverse workforce is undeniably valuable, it can present a challenge for some organizations, particularly in higher-paid positions. HR managers can use this dashboard to ensure that they are on track with their diversity measures. Let us take a closer look at this issue.
- Share of female/diverse by role level: The purpose of this KPI is to measure the number of female or diverse employees who hold managerial positions within the organization. Although it is well known that higher-paid positions are typically occupied by white males, HR managers must ensure that diversity is promoted at all levels of an organization in order to ensure its success. By 2025, most organizations are aiming to increase the number of females or people from diverse backgrounds in managerial positions to 20%.
- Recruitment by ethnicity/gender: This KPI is intended to track the diversity of the recruitment strategy. To determine the share of diverse applicants that are ultimately hired, the KPI is divided by the stages of the recruiting process. In order to avoid bias, it is important to establish diversity measures, such as standardized interviews or the use of anonymous resumes for the selection of candidates.
- Ethnicity by department: As with the previous indicators, ethnicity and gender by department provide insight into the level of diversity within each department. In addition to being diverse, some companies may still be biased when it comes to certain departments, such as hiring men for manufacturing or IT positions or white individuals for administrative roles. As a result, this is an important indicator to monitor.
- Diversity group eNPS: Employee Net Promoter Score (eNPS), also known as employee satisfaction, is an indicator used by HR managers to evaluate how satisfied their employees are with their employer. Here, the eNPS is divided by diversity groups and compared to a target of 75. There are several groups that fall under this target in most organizations today, therefore, it needs to be addressed in order to create an environment that is enjoyable for all.
- Turnover rate by diversity group: Based on the turnover rate by diversity group, the HR team can determine if a particular group is not satisfied with the organization. It gives them a comprehensive picture of the percentage of voluntary leaves by diversity group. The black workers' turnover rate is higher than the company's overall rate in over half the companies today. There are several reasons why this is a concerning number that should be investigated in order to identify causes and implement solutions as soon as possible.
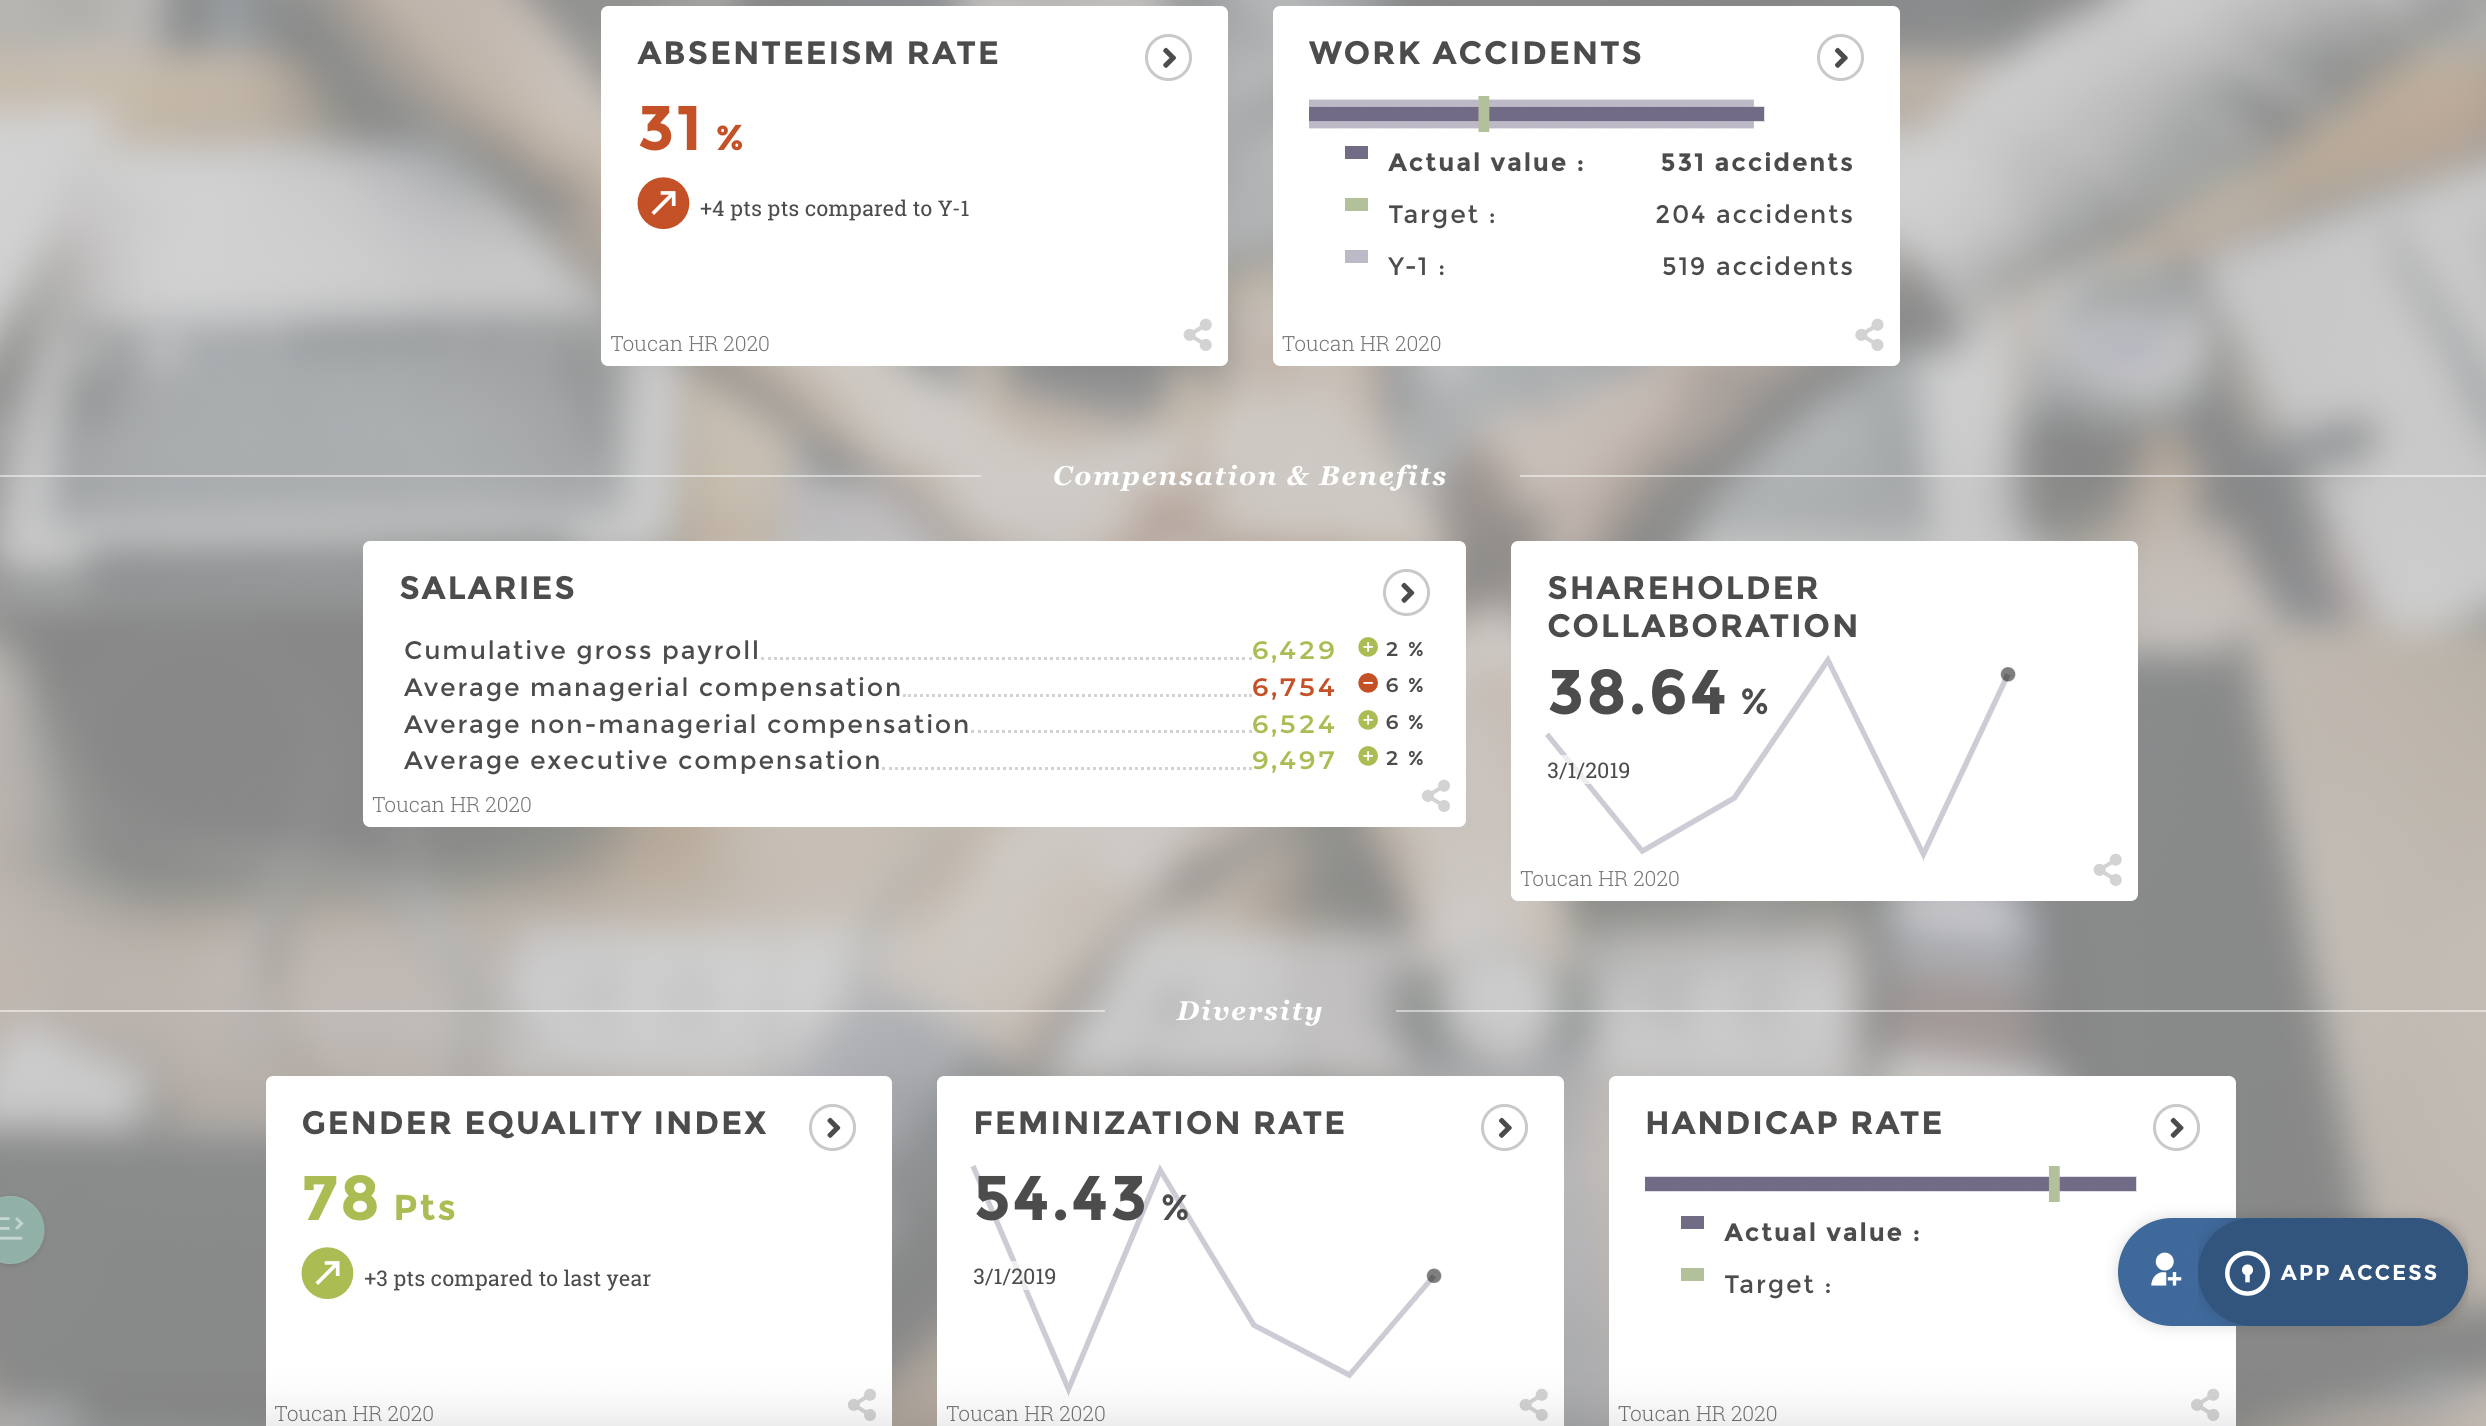
4. Annual HR Report Metrics Examples
In addition to exploring HR reports for management, we have also discussed the practical components of a HR annual report template. As we move forward, we will examine metrics that can further enhance your HR-based activities year over year.
These cost-related metrics can also be used for annual HR analysis reports to show to top management and the financial department:
- Labor cost per FTE: the average expense of labor that a company spends for each FTE on an annual basis.
- Labor cost revenue percent: the total labor cost as a percentage of the annual business revenue.
- Labor cost expense percentage: the total labor cost as a percentage of the total annual expenses.
- Benefits as a percentage of labor costs: the total cost of benefits as a percentage of the total annual labor costs.
How to prepare the annual HR report
HR reports that are non-impactful consist of simply compiled statistics in an Excel or PDF file without much else. Utilize data and visualization in conjunction with stories and perspectives to create an impactful HR report. Since our decisions affect the people and the organization as a whole, we should aim to be more data- and evidence-based. It is important to note, however, that although data can provide an answer, it rarely sends a message because people listen to and connect with stories.
In order to convey an impactful message with your HR Annual report, you need to balance objective analytics with visualizations and data storytelling. By doing so, you will be able to reach a wider audience.
When preparing your annual HR report, you should take into consideration the following factors:
1. Include OKRs and KPIs
- Reflect on the OKRs, KPIs, and goals set by HR and the organization at the start of the year.
- Describe the progress made on each goal in an executive summary.
- Provide four or five key conclusions that are a theme throughout the report. It may be a significant change in your headcount or the success of a leadership initiative, for example.
2. Keep your stakeholders in mind
- Make sure you tailor the annual HR report to the needs and interests of the audience you will be presenting it to. The metrics that are important to a CEO will differ from those that are important to a manager
3. Use Data Storytelling
- Report your data using visuals. If you want your data storytelling visuals to stand out even more, consider using a data storytelling platform like Toucan. For example, you can use a map to display high- or low-performing countries, instead of reporting eNPS per country in a table.
- There is no doubt that management and staff are tired of traditional reports and complex statistics. Rather than using numbers to drive action, turn them into compelling narratives.
- Make sure your stories, reports, and statistics are transparent and easy to understand for all stakeholders.
4. Define the goals for the next year
- At the end of the report, highlight how HR will set its goals based on the business objectives for the following year.
- Identify the metrics you will use. Make sure HR goals are aligned with those of the other stakeholders in the organization
5. Provide a dashboard overview
- Your report should include an upfront dashboard to help stakeholders analyze, visualize, and make decisions.
- This should be consolidated on one page/screen so they can easily refer back to it. The dashboard should not just contain numbers but actionable insights that all stakeholders can understand.
.jpg?width=112&height=112&name=PORTRAIT_Baptiste%20(1).jpg)
