Back


Guided Analytics - what is it?
Guided Analytics is an analytics platform that assists the user in understanding data and using that data to collaborate and drive results.
The rise of self-service analytics that makes data comprehensible for end users is becoming more popular. Guided Analytics are spearheading this growth, tailoring self-service to specific users. Complexity has turned business users away from adopting a data-driven approach to decision-making, killing the enthusiasm for the data analytics process.
Because Guided Analytics and self-service capabilities should go hand-in-hand, what makes a Guided Analytics tool self-serving? Here are the following aspects of Guided Analytics that allow users to glean insights from every use case:
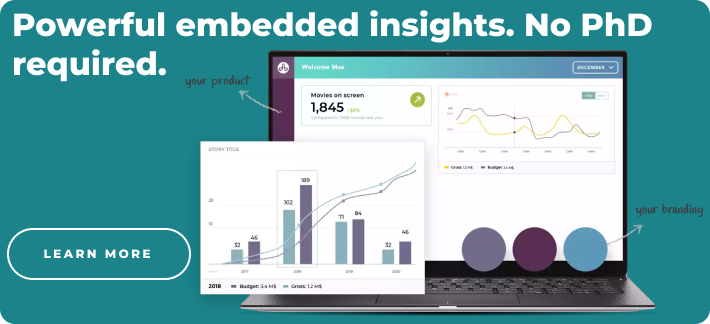
- No code: What good is Guided Analytics if your IT team has to spend days generating them? No code tools like Toucan knock down the gate-keeping factor of coding expertise to bring non-technical users Guided Analytics in real-time.
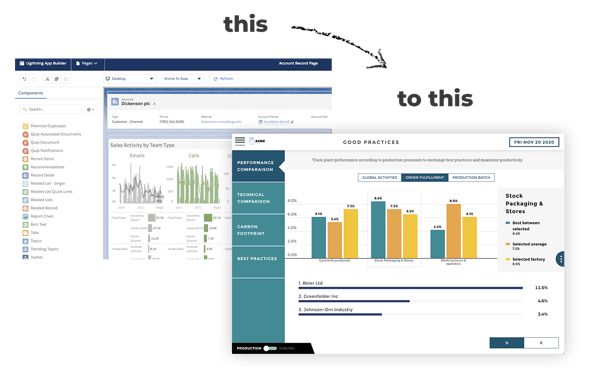
- Data visualization: There is no Guided Analytics without easily navigatable and understandable data visualization. Because visuals can more efficiently portray trends than tables, data visualization is integral to the perfect Guided Analytics tool.
- Flexibility and simplicity: Better reporting is a necessary benefit of Guided Analytics solutions. Reporting flexibility is essential to rapid report generation, without increasing the complexity and technical aspects.
These benefits of a modern, user-first Guided Analytics platform provide many benefits to adopters, including:
- Ownership of data across every department
- Collaboration to build off of insights
- Predictive capabilities
Guided Analytics is the future of self-service data solutions. By providing analytics that matter to employees at every level of the corporate ladder, firms can transition from data-rich and insight poor to a culture that democratizes accessible data.