Data Storytelling - What is it ?
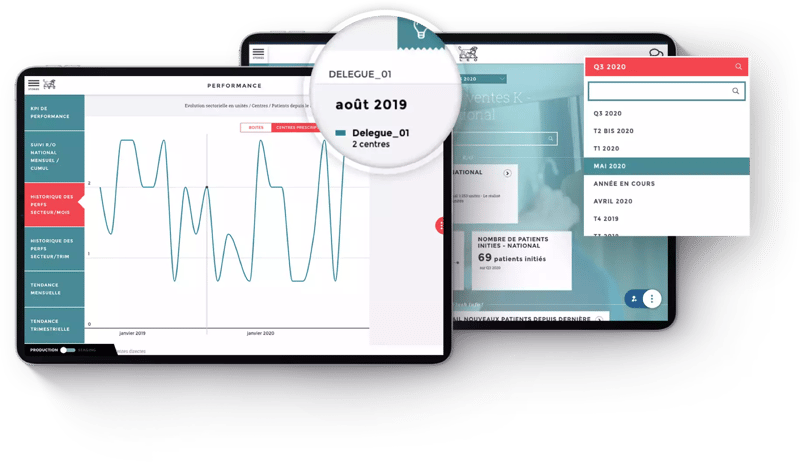
Data storytelling comes from the Data visualization (or Dataviz) field. Data visualization is the art of telling numbers in a clear and pedagogical way, where Excel cannot. It allows you to communicate complex figures and information by transforming them into visual objects: graphs, diagrams, curves, maps, rankings, etc.
 Data Storytelling is a relatively new concept. The idea is to be able to go further in data visualization by emphasizing understanding and pedagogy, to make it accessible to users not familiar with data. The data will tell a story based on the needs of the business. We then go beyond the simple fact of presenting series of figures in a table.
To image, a Marketing Director does not have the same reporting needs as an operational manager of digital campaigns.

Build successfully your dashboard


