


From Data to Insight in Just a Few Steps
Deliver astonishing analytics in your product in a 4 step process.
Back


Deliver astonishing analytics in your product in a 4 step process.
Connect
Compute
Visualize
Embed
Dozens of connectors
Native connectors for state of the art data warehouses and data bases on the market and a web service connector to connect to any API using Rest.
Built-in Storage
Store your metrics Toucan to reduce calls to your data stack. Automate refreshes and combine with live connection if you need the freshest data.
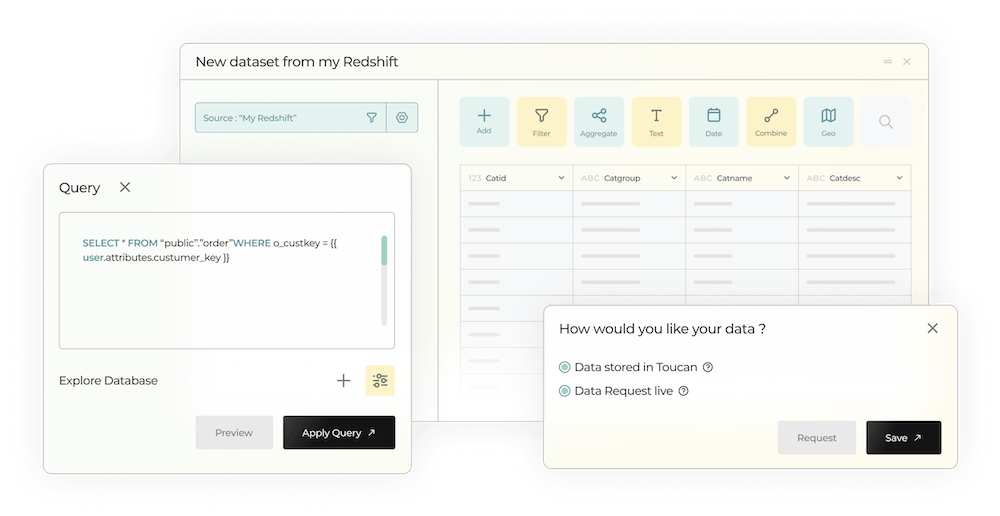
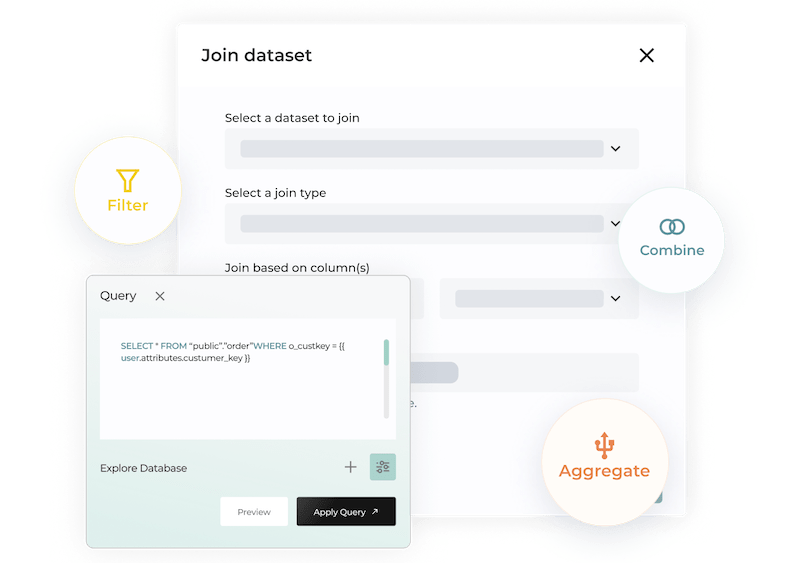
No-Code Data Preparation
Prepare your datasets without writing a single line of code, using YouPrep™ for data joins, filtering, aggregation, and more.
SQL expert? Create your own optimized and complex queries, you can jot down some SQL in our editor.
Comprehensive DataHub
Manage all your datasets in one place. Easily create, edit, duplicate, tag, retrieve and delete datasets.
Intuitive Dashboard Builder - Fully Customizable
Create stunning, user-friendly dashboards with our intuitive drag-and-drop interface.
Tailor every chart to your brand with customizable colors, layouts, and styles to match your brand.
Data Storytelling
Transform your charts into compelling stories, by enriching them with contextual text, tips, glossaries, medias and more.
Manage multiple languages to reach a global audience.
Effortless Product Integration
Embed your dashboards into your product with a few lines of code. Provide your users with real-time, interactive insights—right where they need them.
Security down to row-level
Ensure the right people see the right data with granular access controls, personalized views, and a built-in token management system that keeps users on your side without replication.


Connect
Dozens of connectors
Native connectors for state of the art data warehouses and data bases on the market and a web service connector to connect to any API using Rest.
Built-in Storage
Store your metrics Toucan to reduce calls to your data stack. Automate refreshes and combine with live connection if you need the freshest data.
Compute
No-Code Data Preparation
Prepare your datasets without writing a single line of code, using YouPrep™ for data joins, filtering, aggregation, and more.
SQL expert? Create your own optimized and complex queries, you can jot down some SQL in our editor.
Comprehensive DataHub
Manage all your datasets in one place. Easily create, edit, duplicate, tag, retrieve and delete datasets.
Visualize
Intuitive Dashboard Builder - Fully Customizable
Create stunning, user-friendly dashboards with our intuitive drag-and-drop interface.
Tailor every chart to your brand with customizable colors, layouts, and styles to match your brand.
Data Storytelling
Transform your charts into compelling stories, by enriching them with contextual text, tips, glossaries, medias and more.
Manage multiple languages to reach a global audience.
Embed
Effortless Product Integration
Embed your dashboards into your product with a few lines of code. Provide your users with real-time, interactive insights—right where they need them.
Security down to row-level
Ensure the right people see the right data with granular access controls, personalized views, and a built-in token management system that keeps users on your side without replication.
< 2
weeks to roll out the first dashboard
+10%
in sales closure
"Other solutions on the market required extensive technical expertise on our end, but with Toucan, it was very easy to get started!"
VMR
250+ employees
< 2
weeks to deploy the first dashboard
30,000+
rows of real time data
"Toucan has cornered the market on customer service and without them, we wouldn't be where we are today."
DC Power
30 employees
44
data sources & dozens of users
"Extremely powerful tool-stack that allows me to make something of my data."
Willaman Solutions LLC
SMEs
20 million
data aggregations in Toucan
< 1
month to go live
"Unbelievably impressed with how much Toucan allows us to modify. We have the ability to do anything we need to. It feels like an integrated component of our CSS."

StorySlab
Software
1 million
salaries aggregated
"Toucan truly highlights survey results and helps customers regain control over their salary projects."
Deloitte
460 000 employees


Choose from a wide range of modern charts to display your data with clarity, ensuring the best visual representation for every use case.

Fine-tune charts with No-Code or hyper personalization and remove Toucan branding for a seamless, fully integrated experience.

No-Code query-builder that filter, aggregate, join, and more with just a few clicks. Most transformations steps can be translated to SQL on major data warehouses to leverage their computing power and cache.
Use the Embed SDK to seamlessly integrate Toucan into your application, enabling deeper interactions and complete control over your embedded content.

Create dashboards to distribute analytics in your SaaS, or even in PDF, Toucan Web App, Mobile, or TVs.

Give users the ability to generate their own reports, customize dashboards, and explore charts without relying on admin Toucan users.

Use our Web-App for your internal reporting.
Use the Datastorytelling concept to deploy Toucan Web-apps for a unique BI experience. Offer your business teams beautiful, easy-to-use tools, available everywhere, that will create a culture of management at scale.
Get your metrics out of Excel, Powerpoint and unused traditional BI. Put them in the hands of your users with a unique reporting experience they'll love.
Sales Performance
Financial Dashboard
People Analytics


Big Query
Google Sheet
Snowflake
Elasticsearch
PostgreSQL
MySQL
Amazon Athena
API
Self Service
02 October 2025
9 min
Picture this: a marketing manager needs to know which channel delivered the best ROI yesterday. Instead of waiting for...
Read article
17 September 2025
9 min
Did you know that 80% of large businesses claim that Business Intelligence (BI) is key to their strategic decisions? If...
Read article

CIO & BI Manager
27 August 2025
3 min
At the heart of our mission is a simple but clear goal: to make customer-facing analytics easy to deploy, highly...
Read article
Business Analyst
17 July 2025
4 min
When it comes to database management and query optimization, having the right SQL editor can make all the difference....
Read article
Product leader
26 May 2025
9 min
Practical examples of embedded analytics Looking for concrete embedded analytics examples to inspire your own...
Read article
Product leader
16 May 2025
6 min
Embedded charts transform your data experience by placing interactive visualizations directly into your daily tools....
Read article
Product leader
15 May 2025
5 min
When you integrate analytics directly into your day-to-day applications, you eliminate the need to switch between tools...
Read article

Product leader
12 May 2025
7 min
Data visualizations and interactive reports, which set applications apart five years ago, are now considered the bare...
Read article

Self Service
02 May 2025
11 min
Data no longer belongs exclusively to analysts or IT department. In today’s competitive environment, organizations...
Read article
Turn your data into an engaging and accessible experience. Discover how Toucan can help you integrate interactive dashboards and enhance your analytics effortlessly.
