


What is Toucan 2.0? Introducing the new and improved Toucan
.png?width=88&height=88&name=portrait_agathe_face%20(1).png)
Agathe Huez
Publié le 07.01.22
Mis à jour le 13.01.26
4 min
If you’ve already used Toucan, you’ve probably come to know (and love) the Toucan data storytelling experience. For over six years, we’ve been allowing business users to build compelling stories from raw data, making it easier for them to get their point across, showcase their results, and lead their teams.
At the heart of everything we do, there’s the core belief that data should be readily accessible to everyone, even if they don’t have the word “data” in their job title. We build tools that help put data in everyone’s hands across businesses and organizations.
So what changed with Toucan 2.0?
The Toucan you knew and loved…
We’re still pursuing the exact same goal: helping business users use their data to do what they do best. And in the process, we’ve heard the feedback of our users and customers. They’re overwhelmingly satisfied with the data storytelling experience (we’ve been rated 5/5 on G2). Thanks to Toucan, they can make important business information visually attractive and easy to digest.
But there was a problem.
The rest of the data analytics process was still as complicated as ever. Sure, Toucan allows you to weave compelling narratives from data. But how do you share them? How do you use data insights to take concrete action? And before you get to the step of data storytelling, how do you connect to your data source? How do you clean and prepare your data?
Well, you need to rely on external tools or on the help of data specialists. More often than not, these tools were complicated to use, with a steep learning curve.
So we decided to do something about it.
...Is now an end-to-end, guided business analytics platform
They asked us if we could make other steps of the data analysis process as easy as we had made data storytelling. We started from our specialty: our unique ability to add flow and context to data visualization to build data stories and we worked hard to give non-expert users the same experience throughout the process. After you’ve built your data stories, you need to share them with the relevant stakeholders, and take business actions: we’ve made these processes more fluid for more users. Before you can build stories, you need to connect to your data and prepare it. This is exactly what the new features of Toucan 2.0 allow you to do.
Build data stories with the Data Storytelling Studio
Data visualization has always been at the core of our work. With Toucan 2.0, we’ve further improved the unique Toucan data storytelling studio.
%20(4).webp?width=539&name=illus-usp-1%20(4)%20(4).webp)
- We’ve created an App Gallery and filled it with a wide range of ready-to-use graphics for specific industries or departments. You’ll never have to start from scratch again!
- We’ve added a Guided Design functionality, so you don’t have to ask yourself what font or what color to use, and so you can focus on the big picture.
- With the View As feature, you can see exactly what every one of your users will see, without having to create mock logins.
To learn more about Data Storytelling Studio, head here!
Share your data stories with the Embed and Broadcast feature
Once you’ve built your data stories, what do you do with them? Well, you share them with the people that need them. That’s what the Embed and Broadcast feature allows you to do.
.webp?width=1185&name=product-slider-visual-tabs-1%20(1).webp)
- We’ve made it easy for you to embed your data stories in your own app, platform or website. Get the full white label experience with an analytics brick that looks and feels like your product.
- We’ve made it easy for you to generate pixel-perfect PDF reports from any data stories so you can print out your important figures and share them across channels.
- A modern analytics tool is a mobile analytics tool. This is why all of the data stories you’ll create with Toucan are instantly mobile-ready, with zero clicks!
To learn more about embed and broadcast feature, head here!
Take action with the Action Center
Business data without the possibility to take action is just numbers. This is why we’ve packed our Action center with key features allowing you to collaborate with your team and act quickly.
.webp?width=554&name=SFE%20-%20USP3%20(1).webp)
- You can quickly and easily add context and tips to guide your user on a dropdown screen or a filter panel.
- You can freely annotate any data story to draw attention to important points that might’ve been overlooked otherwise.
- More importantly, you can instantly collaborate with team members by sharing data through Slack, MS team, or via email.
To learn more about Action Center, head here!
Prepare your data with YouPrep
Data prep used to be a big hurdle for non-experts data users. More often than not, they had to wait for a data specialist to jump in and do the work for them. With Toucan 2.0, that’s a thing of the past:
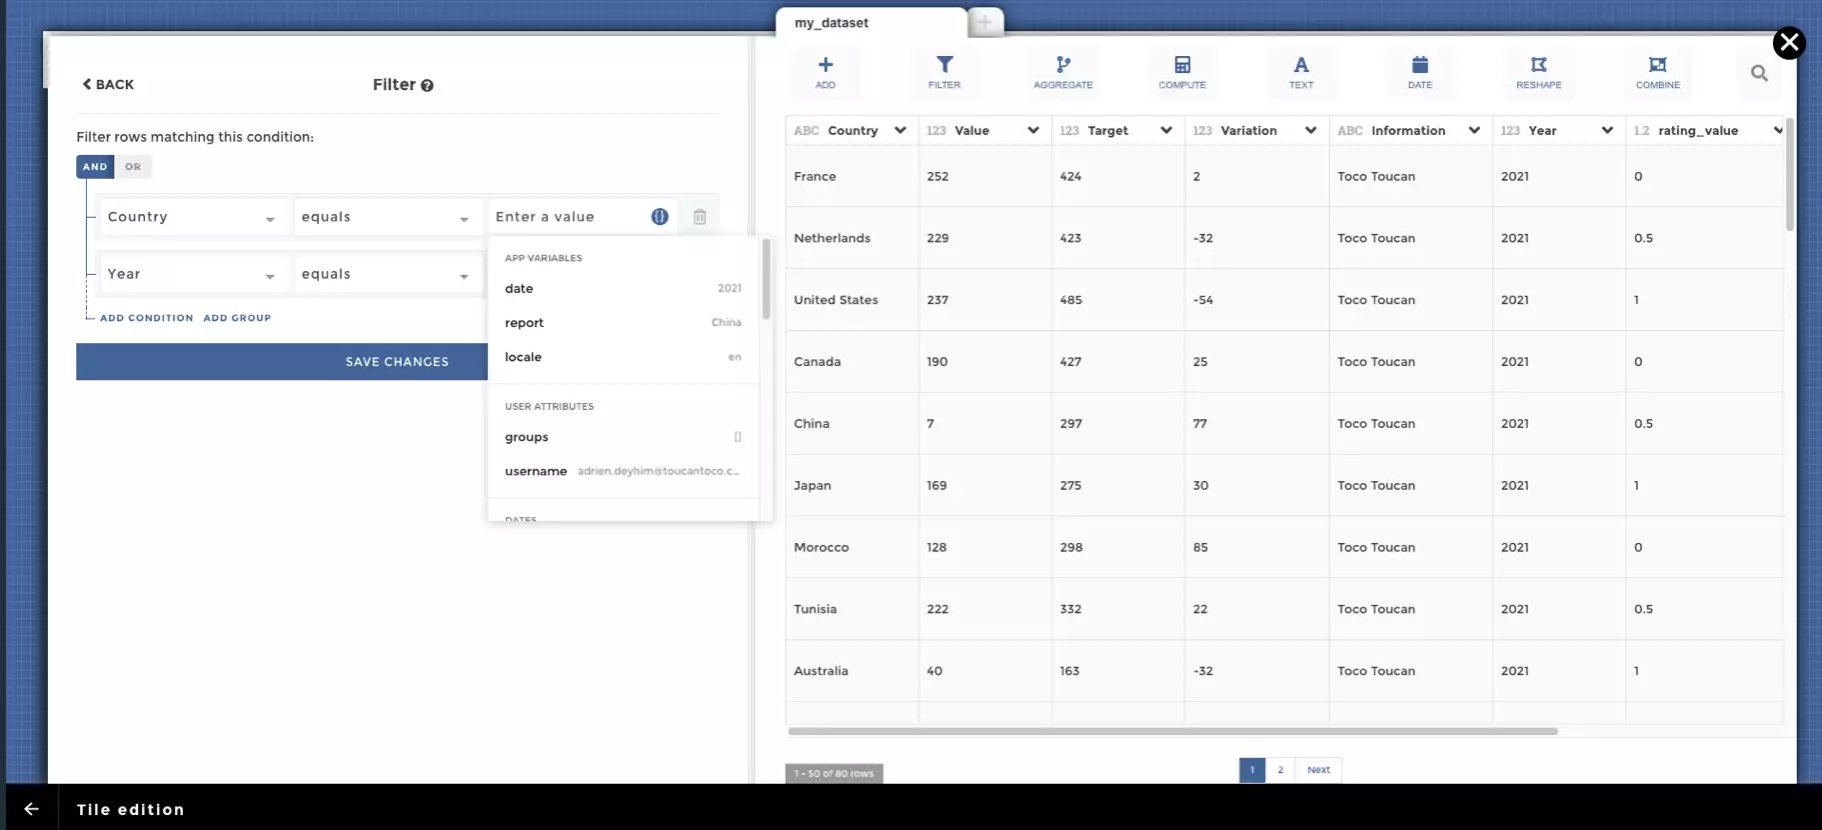
- The main data prep operations are now accessible with no code to allow everyone to get their data up and running in a matter of minutes.
- There’s probably more than just one source for your more important data: YouPrep allows you to Blend data when needed.
- If you handle Live Data, you can now transform it on the fly, as it comes in.
Head here to learn more about YouPrep.
To learn more about You Prep, head here!
Connect to your data with AnyConnect
While all of this is very promising, there’s no data analysis without, well… Data. That’s why we’ve created AnyConnect.
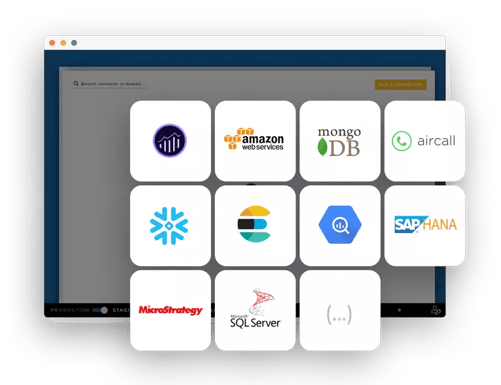
- Connect from any data source, without on the cloud or on-premise: Data equality is important for us.
- If you handle Live Data, having to duplicate and stock the data can be an additional hurdle and a security risk. Toucan is Live by design and allows you to work with Live Data without having to stock it.
- Toucan was born on the cloud: because we’re Cloud Native, we make it easier for you to connect to any cloud.
We’ve packed all of these features in one, seamless platform, so you can use it at a wide scale across your business no matter, no matter your data maturity level. In doing so, we kept true to our core beliefs and we leveraged our obsession with UX and accessibility to make your data experience as enjoyable and simple as ever.
To learn more about Anyconnect, head here!
.png?width=112&height=112&name=portrait_agathe_face%20(1).png)
