


8 key KPIs to follow as a Franchise Manager
.png?width=88&height=88&name=portrait_agathe_face%20(1).png)
Agathe Huez
Publié le 13.01.21
Mis à jour le 13.01.26
5 min
Effective KPI management is an essential component of improving and regulating franchise performance. As a franchisor, effectively managing data and reliable reporting systems across your network is critical.

THE Industry for franchising has been steadily growing For more than 20 years.
And despite the many challenges businesses have faced in the pandemic era, data shows the franchise industry is still thriving. More and more people are putting on their entrepreneurial hats and electing to walk the path of business ownership. Taking the franchise route alleviates some of the fears and the unknowns that come with starting something from scratch. Franchisees start with brand recognition, ways to find and retain employees, local marketing, and the comfort of a tried and tested business model.
Yet despite growth, all the major challenges that come with scaling a business certainly apply to franchises. Especially now. One of the most foundational pieces to scale is creating and adhering to a solid set of KPIs that help business owners understand what they're doing well, what they need to improve on, and how to align their entire community on a shared vision and goal(s).
This article will cover some of the most important KPIs for franchise managers to follow. Enjoy!
How to ensure that all your stores are performing well?
The simple answer is not necessarily an easy one: by managing the most pertinent KPIs, as well as incorporating systems that allow you to benchmark between stores in your network.
To do this in the decentralized environment inherent to franchises, you need to be proactive when thinking about the indicators you are going to monitor to track.
In this article, our focus is on some of the most relevant KPIs to follow, as a Franchise Manager, in order to drive sales and quickly identify operational issues.

Here are 8 KPIs to monitor to ensure your business is healthy:
1. GROSS SALES
Gross sales account for the total number of sale transactions made within a certain time period and represent the amount a store earned and recorded from the sales of its product.
Gross Sales is also defined as the Sales Revenues for a store, before the deduction of Sales Allowances, Sales Discounts, and Sales Returns (Net Sales are the Gross Sales minus the following three figures).
Gross sales is an important metric, especially for retail businesses, because it reflects the total amount of revenue a store brings in over a period of time and can be used to show customers’ buying habits.
This indicator is often analyzed in relation to Net Sales, in order to monitor the evolution of these two values over a given period and to control if there are problems related to product production costs or if there are too many promotions over a given period.
Formula:
Gross Sales = sum of all sales receipts.
Wonder how this looks in a Dashboard? Check out this video: Toucan - Franchise Dashboard creation | 17:36
2. STORE SALES CONVERSION
Store sales conversion is an impactful measure of the effectiveness of your sales teams, monitoring the number of visitors that you convert into customers.
Store Conversion rate is the percentage you get when you divide the number of purchases by the number of visitors (footfall) within a store in a given time period. For example, if a Store receives 200 visitors in a day and has 50 purchases, the conversion rate would be 50 divided by 200, or 25%.
Analyzing the conversion rate of your stores can help shed additional light on things like the effectiveness or marketing campaigns, salesforce, and operational changes. This indicator may also point out the need to review things like workforce planning and inventory processes.
Formula:
Store Sales Conversion = (Number of sales / Number of unique visitors within a store) x100
3. GROWTH RATE
Growth rates illustrate the percentage change of a sales variable for a specific time period. For a franchisor, growth rates typically represent the growth of a single store’s revenues, or earnings coming from the entire franchise network. Growth rate can also be used to express the annual change in revenues as a percentage, and are beneficial for a variety of things including assessing a single location's performance or predicting future output and growth potential.
Formula:
Growth Rate (Revenue) = [Revenue (Today) – Revenue (Last Month)] / Revenue (Last Month)
4. REVENUE PER SQUARE FOOT
Revenue per square foot is your store’s average revenue for every existing square footage of a store sales space available over a given time period.
Revenue per square foot is a key measure of success in many franchises (especially so in retail), leveraged to measure and improve store performance, become more efficient with space utilization, and improve other key franchise management areas like store layout and staff allocation.
Formula:
Revenue per Square Foot = Total in-store sales / Selling area in square feet
5. AVERAGE SALES TICKET
The average sales ticket KPI provides details on the average amount of sales made per customer and is calculated by totaling sales and dividing it by the number of customers over a given time period.
This metric is most often used to analyze business performance, sales activity, and profitability, and helps franchise managers better understand sales trends and improve focus areas. The list of things that this metric can influence is long, but some ways its leveraged include evaluating: cross-sell and up-sell potential, seller or store performance, inventory profitability, and product focus.
Formula:
Average Sales Ticket = Total sales / Number of customer
6. NPS – CUSTOMER SATISFACTION
The customer satisfaction rate is a measurement of a customer’s satisfaction with a brand’s product and/or services. The most common way businesses evaluate customer satisfaction is by using a Net Promoter Score (NPS), which is measured with a single question and reports a number between -100 to +100 (the higher the score, the better).
NPS shows the willingness of a consumer to recommend your brand to their friends and acquaintances, and allows businesses to measure their ability to provide a satisfying customer experience.
The implications of NPS as a KPI are fairly obvious - they can indicate customer satisfaction with your brand as a whole, with single stores, and how you may be able to help your network better support your customer base. Additionally, you may want to explore 5 DataViz Ideas to Breathe New Energy into NPS Analysis.
Formula:
Promoters = Respondents giving a 9 or 10 score
Passives = Respondents giving a 7 or 8 score
Detractors = Respondents giving a 0 to 6 score

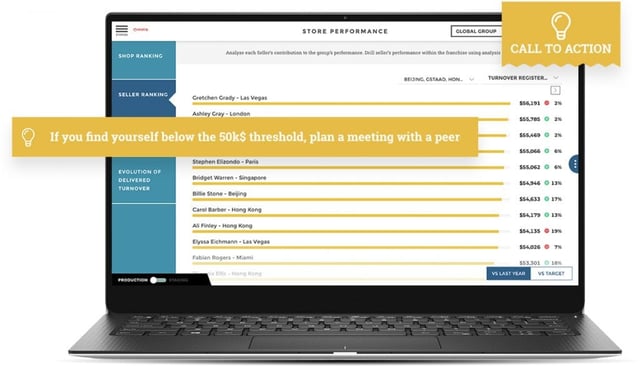
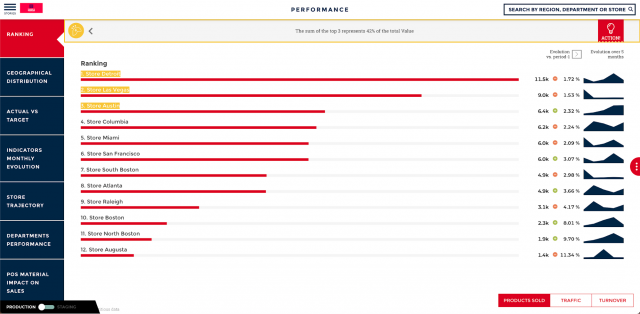
7. COMPARABLE-STORE SALES :
Comparable-Store sales refer to the revenues of a brand generated by a given store in one period compared to revenues generated in a similar period.
Franchise Managers often use Comparable-Store Sales to measure sales growth and evaluate the performance of existing stores relative to newer locations.
Comparable-store sales are also known as same-store sales, identical-store sales, or like-store sales.
By comparing sales over different time periods, Franchise Managers can better understand the performance of a store, as comparable-store sales not only give a picture of the performance of a store in a given region, but of the performance of a store within the overall network.
This is an essential indicator of the health of your points of sale.
Formula:
Same-store Sales = [Total Sales T+1 / Total Sales – 1] x100
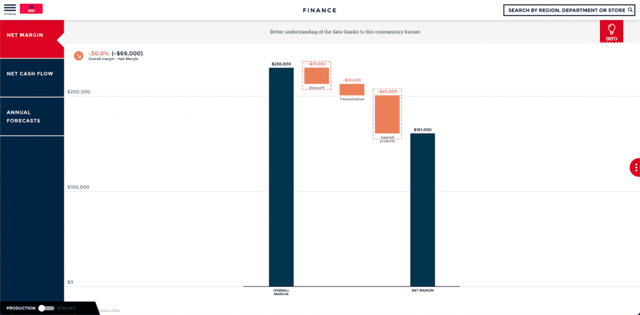
8. NET PROFIT
Net Profit is the measurement of a store’s profit once operating costs, taxes, interest, and depreciation have been subtracted from total revenues. It can also be described as a Net Income.
As in many industries, profit is one of the most important KPIs. By following this indicator, you can quickly understand which stores in your network are the most profitable for the brand and encourage them to share best practices with other stores in the network.
Formula:
Net Profit = Total revenue – Total expenses
The Last Word
Leveraging the KPIs listed in this article will position you to better understand where you're doing well, where you can improve, and how you can do that.
You will be able to create an emulation between locations and quickly identify the processes that bring the most value to your business.
.png?width=112&height=112&name=portrait_agathe_face%20(1).png)
