


How Understanding Stakeholders Increases Dashboard Effectiveness
.png?width=88&height=88&name=portrait_agathe_face%20(1).png)
Agathe Huez
Publié le 30.08.22
Mis à jour le 13.01.26
4 min
-1.png?width=900&name=Blog%20Graphics%20(17)-1.png)
Democratizing data can be difficult if the end users are not incorporated into the dashboard-building process. As a data analyst or information professional, you have already chosen the analytics solution that satisfies your organization’s expectations or decided on building your own dashboard. The most important aspect of the dashboard creation process lies ahead, and it has nothing to do with actually creating it. Carefully choosing and interviewing your stakeholders lays the foundation for dashboard design and functionality.
Your stakeholders will be the end users of your dashboard, making them the best consultants for dashboard building. Because your relevant stakeholders will have to change their workflows, learn to use a new software solution, and are expected to perform better when using the dashboard, asking them the right questions about what they expect and need from a dashboard is essential.
Before prototyping a dashboard, a feedback loop must be established between data analysts and stakeholders. As a data analyst, you already have expert-level knowledge and may already envision the finalized dashboard, but you’re creating it for the end user.
Identifying Stakeholders
Before you begin asking questions, you must choose the most qualified and responsive stakeholders. Because dashboards are used by a variety of stakeholders in every industry, this will vary depending on each use case.
For example, your CFO needs a dashboard to get a big-picture overview of his business. In this situation, the CFO would be the only relevant stakeholder to interview about dashboard creation. In another example, a VP of sales reaches out about creating a dashboard application for her salespeople in the field. Because she manages a team of over 20 salespeople, the interview process would include 3-5 of the highest performing salespeople.
Whatever the case, at least one qualified stakeholder must be consulted about their expectations. Without conducting a detailed and thorough interview, your dashboard deployment process is destined for a frustrating reception.
Conducting the Interview
Let’s revisit our CFO example who expressed interest in creating a dashboard for his big picture KPIs. How do you know what specific KPIs to include in his dashboard? Or how and where they will use it?
The way you structure your stakeholder interview can affect the feedback you receive for better or for worse. Here is a checklist of the most important questions to ask and how to structure them effectively.
- Why do they need a dashboard? What are they expecting and hoping to achieve from using it?
This may sound like a question that is too general or unhelpful but allows the dashboard builder to ask more informed follow-up questions. For example, a CFO may need a dashboard to monitor financial ratios, operating cash flow, and gross profit margin. They are hoping to draw clear insights into their organization’s financial health during an economic downturn.
Taking note of these general needs and expectations, a dashboard builder can now ask about more specific aspects of the dashboard that are relevant to the stakeholder. Asking these questions can also make the stakeholder feel more involved and engaged throughout the rest of the interview.
- What KPIs are necessary to make the dashboard as effective as possible?
This is the most important question in any dashboard stakeholder interview. KPIs are the foundation of dashboards. They vary wildly by industry and position, and each stakeholder will include different KPIs. For example, an HR executive will include KPIs like absenteeism rate, time to fill, and employee turnover rate, while a sales dashboard will include average profit margin, sales targets, and lead-to-sales percentage.
Once your stakeholder gives you a list of KPIs that they want to include, chances are it will be too long. Because a confusing and cluttered dashboard will only frustrate your end user, it is important to follow up and ask for the most important 8-12 KPIs and explain that fewer KPIs will drive more insights and reduce confusion. - Where and how will the dashboard be used?
This is another question that is very helpful to ask as a dashboard builder. You will have likely chosen a solution that can display dashboards effectively on any device or format, but asking this question will impact how many KPIs to include. If your CFO intends to use his dashboards frequently on a meeting room TV, a dashboard builder can include a higher number of visualizations because of extra screen space. Analytics solutions such as Toucan offer device optimization for their applications, meaning that all dashboard applications can be used seamlessly on any device without building multiple dashboards for each.
On the contrary, if a dashboard must be used on a mobile device on the move, like sales professionals in the field, a dashboard builder will have to decrease the number of KPIs to adjust for the smaller screen.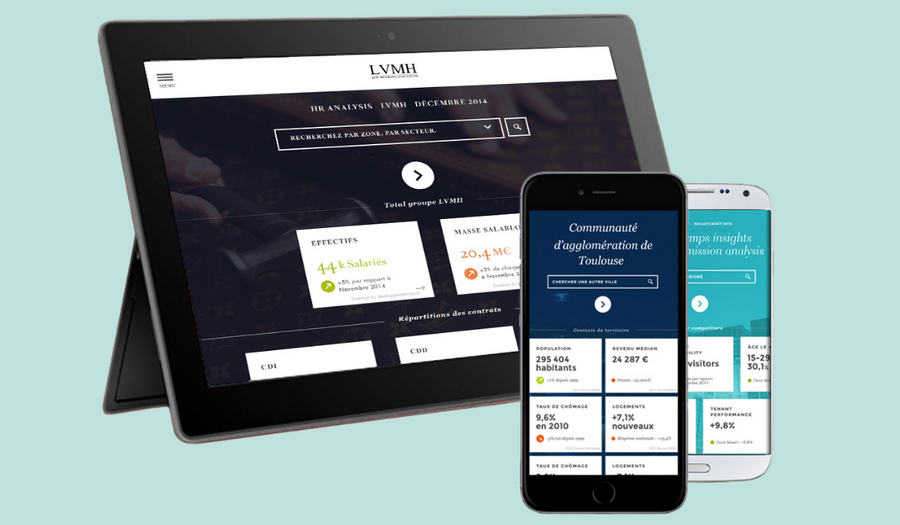
- What experience do the end users have with data visualization, and how can we simplify the deployment process? Are we prepared for training, and onboarding, and can users change their workflows?
These questions help a dashboard builder gauge how prepared the stakeholders are for deployment and onboarding. By asking how comfortable the stakeholders are with learning new software and changing their workflows, a dashboard builder can help lay the foundation for the deployment process before prototyping begins. If you have chosen a solution like Toucan for your dashboard building process, this question becomes much easier to answer for you and your stakeholders, since its 0-code functionality decreases onboarding time and training.
If the relevant stakeholders express reservations about learning new data visualization software in a short period of time, a dashboard builder may ask HR to provide comprehensive training ahead of deployment. It is also an opportunity to encourage skeptical end users and explain how the solution will benefit them in the long run.
- When do dashboards need to be deployed and usable?
This last question allows the dashboard builder to set a timeline for prototyping, deployment, and onboarding. If stakeholders need a dashboard to be ready ahead of the expected date, data analysts can discuss ways to expedite the process without sacrificing dashboard efficiency. The same applies to an extended date; data analysts can then take more time to establish a feedback loop during the prototyping phase to perfect the visualizations. By using a tool like Toucan that builds applications within days, data analysts can spend more time planning and prototyping without worrying about extending their projects.
Why Does Stakeholder Feedback Make Dashboards More Effective?
Too often, data analysts and dashboard builders will assume that stakeholders will find their prototypes most effective and adapt to their vision. Although analysts have the expertise to offer suggestions and amendments to the process, including stakeholders is the foundation for a successful dashboard deployment. If your stakeholders are not as excited about the dashboard as you are, deployment and onboarding will feel forced and unenthusiastic.
An unenthusiastic shareholder correlates to low adoption. Many organizations are struggling with analytics adoption rates, with only 25% of users adopting modern analytics solutions. Toucan’s adoption rate is well above the average at 80%, which is a byproduct of involving non-technical users and involving them in data ownership.
Although many solutions offer features that decrease strain on stakeholders during the deployment process, Toucan’s 0-code usability can expedite app deployment and onboarding. Because dashboards are used by non-technical users, a user-friendly dashboard that can be manipulated on the fly without code allows stakeholders to retain ownership of their data.
Toucan’s applications are also optimized for any aspect ratio and can easily transition between a desktop, a mobile device, and a TV. Without having to build dashboards for each device, Toucan’s applications are versatile for any use case. By expediting onboarding, providing device versatility, and catering to the non-technical user through 0-code functionality, Toucan can make a stakeholder interview simpler and generate enthusiasm about building a data-driven culture.
.png?width=112&height=112&name=portrait_agathe_face%20(1).png)
