Résumer cet article avec :
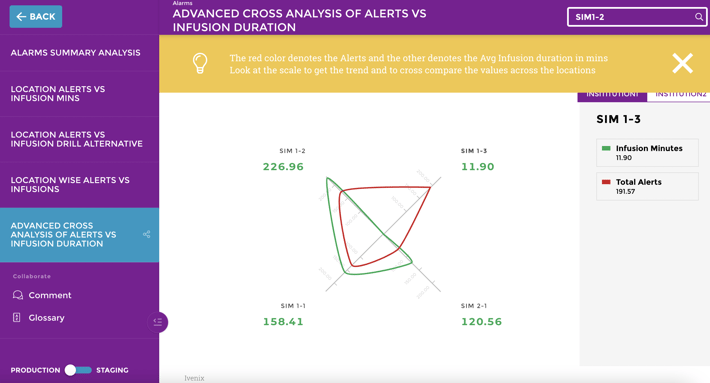
The CISO dashboard is typically designed for two types of users: those who require tactical data and those who require strategic information.
A strategic use case would satisfy stakeholders with concerns about governance, while the use of the top metrics would satisfy stakeholders with tactical concerns. As part of the NIST Cybersecurity Framework (CSF), ISO, or any other framework you may be using, you should expect to see key risk indicators (KRIs).
Ideally, each of these metrics should be combined logically but it may be useful to begin with the tactical metrics. Our objective is to create a dashboard that allows us to add as many tactical metrics as required based on business and risk factors.
4 Key Tactical Metrics for a CISO Dashboard
In order to compose metrics that are meaningful to you, you must first identify your business and risk drivers.

There are five main metrics areas to consider, each requiring progressively more sophistication:
- Coverage: In the early stages of maturity, most organizations focus on breadth, but depth is equally important. Here is an example of how the metric could be used:
- Breadth: 70 percent of a company's data center and cloud assets are covered by its vulnerability management program. By the end of the year, they aim to reach 100 percent.
- Depth: 80 percent of a tech company’s compute stack is covered by the current security program. By the end of the year, they want to reach 85 percent coverage. A portion of our stack consists of business logic, data at rest/motion/use, container security, host security, etc.
- Remediation (backlog) efficiency: This is sometimes called “remediation” or “mitigation” management. Here is an example of how the backlog works:
- The month of January results in the accumulation of 200 high-priority remediation items, as well as the resolution of 50 items. As of February, you have added 50 more and resolved 50 more. It is the same in March as well.
- The cumulative backlog management rate of closed vs. open is 150/300 = 50 percent.
- In the case of high-priority risks, we currently have a remediation effectiveness rate of 50 percent. By the end of the year, we hope to reach a 75 percent effectiveness rate.
- Risk exposure rate: It measures the rate at which new risk is exposed. Here is an example of how this works:
- The production of a new product begins in May. In preparation for this release, 150 critical vulnerabilities were discovered and remedied in pre-production. The production environment was later found to contain 10 more vulnerabilities.
- Another release was made in June. A total of 50 vulnerabilities had been discovered and remediated in pre-production prior to the release of that version. Several more bugs were discovered in production later, which may be related to either release.
- In March, we will have the same scenario, but in this case, there will be 50 participants and 10 participants.
- In other words, 30 vulnerabilities were exposed, while 250 were not. There are 270 vulnerabilities in total. We obtain the average by dividing exposed over the total (30/270) and rounding up to 11 percent.
- While this is only one example, the goal should be to identify as many risk exposures as possible.
- Time to event: This is often referred to as a measure of whether or not a service-level agreement (SLA) has been met. In addition to threats and vulnerabilities, your security team should take into consideration the following:
- Time to discover: How long did it take to discover a threat or vulnerability?
- Time to contain: How long did it take to contain or mitigate the threat or vulnerability?
- Time to eliminate: How long did it take to remediate and or remove the threat or vulnerability?
- Total time to address: This is the sum of the first three.
7 Strategic Cybersecurity KPIs to Track
These are some of the strategic cybersecurity KPIs and metrics that you can track and present to your stakeholders:
1. Level of Preparedness
Do you have a sufficient number of up-to-date and fully patched devices on your corporate network? In order to reduce the risk of vulnerability exploits, vulnerability scanning and vulnerability management are important CIS controls.
2. Unidentified Devices on Internal Networks
By bringing your own devices to work and by installing poorly configured Internet of Things (IoT) devices, employees can introduce malware and other cyber risks into your organization.
3. Intrusion Attempts
During a given time period, how many attempts have bad actors made to gain unauthorized access? In order to gather this information, you may need to refer to firewall logs.

4. Security Incidents
Can you count the number of times your network or information assets have been breached by an attacker in a given time period?
5. Mean Time to Detect (MTTD)
MTTD is a measure of how quickly your team detects threats and indications of compromise. This provides a better understanding of the average time it takes for security threats to be detected.
6. Mean Time to Resolve (MTTR)
MTTR measures how quickly your team resolves indicators of compromise and other security threats. It gives you an understanding of the average response time when your team becomes aware of a cyber attack. MTTR is a great measure of the quality of your incident response plan implementation.
7. Mean Time to Contain (MTTC)
MTTC measures how quickly your team is able to contain a cybersecurity risk that has been identified. It helps you understand the average time it takes to close identified attack vectors across all endpoints.
Why are Cybersecurity Metrics Important?
According to Peter Drucker, what gets measured gets managed, and cybersecurity is no exception. The effectiveness of your security efforts cannot be determined without measuring them.
Cybersecurity cannot be considered a one-time event. The technology and processes that must be used to prevent cyber threats must evolve as well. On a regular basis, you should evaluate the effectiveness of the safeguards you have implemented.
This is important for two reasons:
- A key performance indicator (KPI), a key risk indicator (KRI), and a security posture can all help you understand how your security team functions over time. Making better decisions regarding future projects will be easier if you understand what is working and what is deteriorating.
- By demonstrating high priority to the management and board, you can show them that sensitive information and IT assets are protected and secured.
The increasing interest among shareholders, regulators, and boards of directors has made reporting on cybersecurity metrics and providing context for them an essential part of the jobs of many Chief Information Security Officers (CISOs) and Chief Information Officers (CIOs).
In industries such as financial services, board members are legally obligated to manage cybersecurity risks and protect personally identifiable information (PII).
The best IT security professionals use metrics and to tell a story, especially when giving a report to non-technical colleagues. The easiest way to do this is by using an analytics solution that is made for users of all technical levels.
.png?width=112&height=112&name=portrait_agathe_face%20(1).png)
Agathe Huez
Agathe is Head of Brand & Communication at Toucan, with over 10 years of experience in marketing, branding, and corporate communication, particularly in the SaaS and tech B2B sectors. An expert in brand strategy, storytelling, and public relations, Agathe helps businesses give meaning to their communication and showcase their expertise to clients and partners. She plays a key role in growing Toucan’s visibility and positioning as a leading embedded analytics solution, both in France and internationally. On Toucan’s blog, she shares insights on how to build impactful B2B brands, create memorable experiences, and turn data into a true competitive advantage.
Voir tous les articles

.png?width=88&height=88&name=portrait_agathe_face%20(1).png)
