


Inside, you will find all the keys to lead an effective data project as a bi manager and communicate data to your teams. To make it crystal clear, I am going to tackle this subject through different parts:
- Data Strategy: How a company’s CDO can democratize access to data
- How to Lead Data Projects Efficiently in the Software Industry
- Data Storytelling vs Data Exploration
More info on these themes in the data chief category of our blog.

But first I’m going to introduce myself, so we can get to know each other a little better. My name is Lucy Schweizer, I am the Head Of the delivery Team at Toucan Toco, and my role is to guarantee that all stages of a dashboarding project are respected from start to finish.
Why did I decide to express myself in this guide? Simply because it is important as a BI to have a validation by the experience of the needs and different steps to follow to succeed in a data project from end to end.
And as it’s been 5 years since the method I’m going to deliver has successfully equipped more than 130 companies, know that we have been able to refine it so that it is ready for you!
Are you ready to get the bottom of it? Go!
Data Strategy: How a company’s CDO can democratize access to data 💡
You know certainly that business Intelligence has sparked a great deal of interest but hasn’t met its main objective: to process and deliver data in a form that can be used for a company’s day-to-day operations, including by those who are new to working with data.
On the other hand, companies gather huge quantities of data but don’t know how to make it actionable.
However….

Many businesses today have understood the importance of data’s “last mile”, and large companies committed to developing a data strategy can be seen by an increase in the number of CDOs – Chief Data Officers.
#1 BI: A RISKY BET
A great deal of data is already available within companies, whether it’s meant for internal or external communications, to help steer the company’s performance or offer a more in-depth understanding of their industry. Businesses collect data about their product, as well as about clients and buying habits, from various different sources, including points of sale, panels, distributors and social networks.
The tools and technologies available to access this important information are often challenging to use. Only a few people in the company, experts in these tools, are able to use them to retrieve the data that is needed by the company’s various different professionals.
This is a significant problem faced by many companies – they often don’t have the teams or the tools required to analyze and make the most of the data that they collect.
A few figures
The amount of data collected increases by 60% per year. Nonetheless, 62% of employees don’t have the skills or tools necessary to use this data in their decision-making processes.
McKinsey Global Institute shows that in the United States, between 140 and 190 thousand more professionals capable of analyzing this data are needed. In 2018, the gap between the demand for these professionals and their presence in the workforce could increase from 50 to 60 percent.
For this reason, data often stay stuck in indecipherable tables and are therefore unused. This is why developing a data strategy has become so important.
#2 WHAT IS A DATA STRATEGY?
Definition
This term refers to an information management strategy. It enables companies to better understand their environment, their audience, and their performance. By focusing on this data, companies can make it easier for the various different professionals in the company. They process interpret and share information, as data is only useful if it is actionable.
Please remember this word well because that’s the winning point!
The goal is to make this data the foundation for decision-making and communications. Nowadays, the CDO is tasked with democratizing access to this information and rendering it useful for all collaborators.
So, the most important question is…
#3 HOW CAN DATA BEST BE USED TO ASSIST WITH THE COMPANY’S GOALS AND OBJECTIVES?
This question is frequently asked by CDOs. To develop a data strategy, the first step is to create a data culture within the company.
How do you create a data culture
A data culture brings to light a new way to collaborate, as data becomes the key resource for communications and decision-making. In meetings, employees gather around dashboards, whose performance indicators or KPIs have been chosen together.
Consequently, they have a clearer perspective on the impact of their own work, as well as on the work of the entire team. Decisions are no longer made by instinct, they are made after a detailed analysis of the available data, yeah!
And it’s essential that employees must be the primary drivers of this data culture. They must know how to access the data that they need, how to analyze it, and if necessary, how to share it.
Because this lets them precisely address issues that are specific to their fields. For example, an HR team might want to track absenteeism in the company, while retail professionals might look at employee performance, as well as sales results, possibly even for each product.
The more they contribute the more your project will be fine-tuned, you get it?
But there’s a magic ingredient that you have to add to all of this to make the recipe for your project meaningful: data storytelling! What’s that?
Read on.
#4 BEYOND DATA STRATEGY: DATA STORYTELLING
Real fact: the benefits of having a data strategy may be diminished if the tools used to manage and display a company’s data don’t suit their needs. Too often, data can be found in too long Excel reports. OMG, you know that is true!
And we are aware for sure that data is not actionable if it stays in its complex, raw form. The available tools must enable professionals to work towards this crucial “last mile” of data.
This is why we created ToucanToco. We want to democratize access to data, so it is no longer necessary to be an expert to use it.
To accomplish this, we strengthen data culture through data storytelling. Indeed, data storytelling is a way of putting data into context, creating a story that shows information in a series of simple images, making it easier to understand complex elements.
Let’s now take a more concrete look at the management of a data project from a technical point of view.
How to Lead Data Projects Efficiently in the Software Industry 🚀
Let’s be honest. When data projects drift over time or deliver less than promised, hell is around the corner whether you are the client or the project manager.
All project managers I know have lived through data projects where nothing goes as planned. But I say, never again! After ten years of project management, I started crafting the ultimate checklist to avoid a nightmarish data project.
.webp?width=640&name=Capture-d%E2%80%99e%CC%81cran-2019-06-11-a%CC%80-10.00.02-1500x995%20(1).webp)
Now, as the head of the Delivery Team, I tested my checklist at scale. And it’s working like a charm.
Here is a little bit of context, so you understand my data project playground.
At Toucan Toco, we want to make people successful by helping them to make better decisions based on data. Our web app shows data in well-designed and playful data visualizations and storytelling. Access to data is not a privilege for a happy few anymore.
Our clients are all kinds of decision-makers and teams in Fortune 500 companies: CIO, CMO, C-LEVEL, HR departments… you name it. What we call “projects” are the setup and configuration of our software within these companies.
After delivering more than 300 data projects to more than 100 clients in the past five years, we found a golden rule to install pure joy, happiness, and success into data-driven projects. It starts with :
A shared vision acknowledged and respected by all. ⭐️
It is like creating your own state with a set of rules that everyone commits to following. How do you enforce these rules? On what pillars do they stand?
To answer this question, we created the ultimate checklist of the alignment levers to guarantee successful data projects. I am happy to share this with clients/buyers, as well as project managers.
(Scroll to the end if you want to download the Data Project Checklist now!) ⬇️

Let’s rock this recipe to be crystal clear!
#1 Our recipe is simple 🍝
- 1 Delicious Pain, so you complete a data project that makes sense.
- 4 Committed Stakeholders, who can arbitrate between options during the project.
- Clear Key Success Factors, so you know what needs to be checked to consider that the project is a success.
- A Slice of Data, because there isn’t such a thing as qualitative data and the available one.
- Excellent Communication, so everyone is always on the same page
- 1 Methodology, so everyone acts consistently.
Mix it with good energy, a good mood, one a beautiful smile and voila: success!
This Data Project Checklist is about getting your delivery team working together, following a set of rules that will lead the project to success.

Now, let’s deep dive, and explore the magic of successful project management.
#2 Building the dream team for each data project
The People you need around the table: Sponsors, Business Owners, Data Owner, and a Project Manager.
Each of these people is in charge of a specific workstream of the project. So, having these four stakeholders committed to the project is critical for the success of the project. If one of these people is not defined, you should run from the project. It will fail. Right?
Let’s see their role:
- The sponsor ensures that the project will be pushed forward before, during, and after the project delivery. You need people who actively believe in the project to motivate the troops and promote the work efficiently within the company. We call these people champions.
- Business Owners know the reason why we need to do something. Set the goal of the project by sharing their pains, frustrations, or needs, provide food for thought, validate the implementations made during each step of the project.
- The Data Owner (DO) feeds the project with realistic materials. “DO” knows where the information is, how to extract it, or how to manipulate it to produce valuable insights. He is responsible for on-time data delivery, is the guardian of a pragmatic approach, the key to ensuring successful project delivery.
- The Project Manager (PM) is the orchestra conductor. He is responsible for the global monitoring of the project, its rhythm, timing, and closure, establishes an efficient communication between the other stakeholders, prevents the project from deriving from its original scope.

#3 Golden rules to make a data project successful [step by step]
-
Step 1: Know your end-users
The dream team must identify the persona of the project. You must know the answer to the question: Who are the end-users?
As, you want their lives to be easier at work, help them make better decisions by developing this project. Now, let’s make sure that we know who these end users are, their pains, and how the answers we find may change their lives.
You should identify the persona of your end-users, so the project meets their expectations and answers their needs.
-
Step 2: A Pain there must be
A successful data project is a useful project, a project with a purpose.
It is something with a Return On Investment. You want the answer to this pain or business need. The project output is that answer to the pain or business need. It is also a frame you can refer to when you need to make decisions on the project.
-
Step 3: Define Key Success Factors
All stakeholders must communicate KSFs. [Disclaimer: Please engrave your KSFs in marble.]
Depending on the stakeholder, the success factors can be different. Writing them down makes a real difference. For some, there might be a deadline, for others a specific functionality.
For instance, for a sales dashboard, device responsivity can be a KSF if the sales team needs access to their performance figures from different devices (smartphones, computers, etc.). Or perhaps they need data available in two languages.
You can figure out that having all the stakeholders agree on the KSF gives a frame to the project. It also commits everybody to the same goal, so make sure you refer to it when you need to make a decision.
-
Step 4: Available Data
Duh! A pain or defined business need is essential, but you also need data to bring value to the project. Data must be available, clean, and properly formatted to be used efficiently in a project.
The Data Owner handles the data complexity. The Data owner is necessary to create value from the data and to deliver it to the end-users.
-
Step 5: Recurring communication
You want to open communication. Clear, honest, scheduled, and recurring communication. Also, this works better with a dedicated tool.
At Toucan Toco, we chose Trello to manage our projects and to host all our interactions with the project stakeholders.
We open a new Trello board to all the stakeholders at the beginning of each project. We gather every vital piece of information (contacts, meetings minutes, Key Success Factors, actions, and more) in one place. Also, there are no emails. Everybody has access to the same level of information and can interact with each other.
Everything is out in the open, nothing is hidden, and everybody assumes their responsibility for their dedicated tasks.
-
Step 6: A Methodology to rule them all
Your project methodology must be acknowledged and respected by all. Everybody needs to believe in this methodology and be ready to commit to following it for the sake of the project. Your methodology allows you to timebox the project and make sure that it doesn’t drift over time.
At Toucan Toco, we created our project methodology inspired by the Agile principles. We believe that to deliver our projects quickly and efficiently, regularly getting feedback is necessary.
We decided to slice the projects into sprints/iterations, where the stakeholders can express their feelings and thoughts about our developments.
From Day 1, we work on the final material, and we improve it together with the stakeholders over time and iterations. It is all about getting and prioritizing their feedbacks.
All our projects follow the same methodology and Project Journey.

To give it a handy gift, here is the Toucan Manifesto which sums up all our best practices for a successful project. (Obviously, the client and Toucan Toco pledge allegiance to the ten ground principles of the Toucan Manifesto to make the project successful.)
Here we are: a robust project methodology gives us precisely more confidence in the data project management. It enables us to deliver our projects efficiently. And, as a consequence, it boosts client satisfaction.
But precisely how do we manage to take decisions to make these customers happy, or to perform better? You might say, “well, the figures speak for themselves!” They do, but without any context, it’s not so simple.
That’s why now I’d like to talk to you about storytelling?
Read on!
Data Storytelling vs Data Exploration 📖
First, I would like to highlight our mission statement at Toucan Toco: to equip the novice user with a tool that lets him/her easily access company performance data.
Then, one of the first observations that we made was that there are two distinct types of situations when it comes to analyzing data.
On the one hand, we have Data analysts who want to explore data while novice beginners want quick access to data.
To meet the needs of the latter, we created the concept of Data Storytelling which is quite different from Data Exploration.
So let’s clear up some misconceptions between the two.
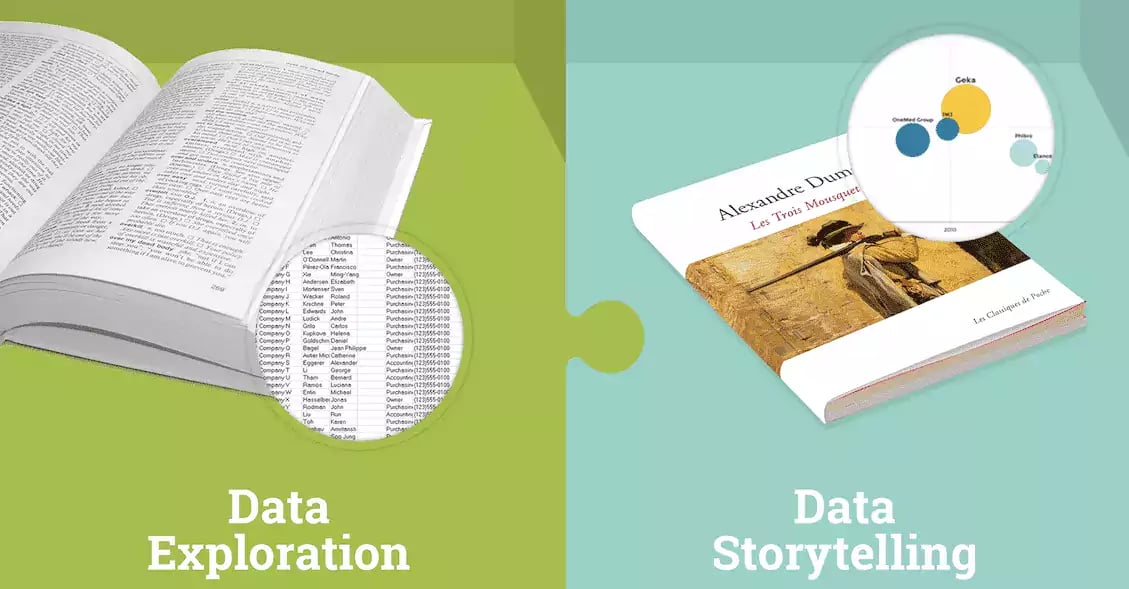
.webp?width=1088&name=Capture-d%E2%80%99e%CC%81cran-2017-05-03-a%CC%80-17.03.48%20(3).webp)
These two photos show the remarkable distinction between Data Storytelling and Exploration.
#1 DATA EXPLORATION IS FOR DATA ANALYSTS
The analyst is the expert and knows how to use a unique tool. This analyst might use the same tool intensely for many days in a row. He explores the database thoroughly before communicating it to another person.
Excel can be used for data exploration
Other Business Intelligence tools such as Business Object, IBM Cognos, Oracle BI, or even PowerBI, Qlik and Tableau Software can also be used for data exploration. These software tools are used to explore the database to answer complex questions.
Here is an example of data exploration
For example, let’s say that you want to know how many women, between the ages of 25 and 35, who belong to the same fidelity program, have purchased an item from the meat section as well as a chocolate bar that was on sale in the last 23 days.
This is clearly an analyst’s job.
#2 DATA STORYTELLING IS FOR THE NOVICE BEGINNER
Data storytelling lets a beginner easily use a tool and then apply it to a situation.
A non-technical business decision-maker might only use this tool a few minutes every week, but must be able to use this tool instantly without help from an expert. And that’s not only revolutionary, but it puts also the data in your team’s hands.
The data is accessed instantly and the information can be easily used for buying, selling, managing, marketing or directing. This type of user is more likely to be a salesman, a Human Resource Manager, someone in Finance or Marketing or even a company Manager.
This is what Toucan Toco is dedicated to accomplishing. Our main goal is to help users who are unfamiliar with data analysis to make better decisions based on their databases, thanks to Dataviz, yeah!!
Then, Mobile Applications allow also easy access to the company’s main information in just a few clicks.
An example of data storytelling
Let’s say you want to know the exact sales revenue per day, per month, per year, for a certain department, as well as a comparison with the same results for the previous year. This data query is clear and hierarchical.
Data Storytelling is The way to go here.
#3 TAKING CARE OF OUR CLIENTS
Comparing Data Exploration to Data Storytelling is like comparing ‘The Collins Dictionary’ to an award-winning piece of literature, or like comparing IMDB’s database to The Game of Throne’s last season; or like comparing a 19th-century pictorial art dictionary to a temporary exposition at an Art Museum.
Would you rather take a dictionary or a novel to read the next time you went on vacation? You have already the answer, right?
Even though every word in your book is in that dictionary, the information presented in the novel is destined for a reader, whereas, the dictionary is set up so that a specialist can find exactly what he is looking for.
Here at Toucan Toco, our 85-team members, 130 clients, as well as the 38,400 users believe in Data Storytelling. And you?
Conclusion

I hope this guide helped you to understand to democratize data in your company and be more efficient in your task.
After quite a bit theory, you’ll pick up some of the content? This is just ⤵️
