Chief Operating Officers (COO) have some of the most demanding workloads in any organization, ensuring that all operations are executed as efficiently as possible. Whether they’re managing a startup or a multinational corporation, COOs must analyze anywhere from tens to thousands of data points to ensure that processes and employees are bolstering their bottom line.
These data points result in terabytes of raw data that are stored in your organization’s data warehouses, ready to be converted into actionable insights and data stories. Although your organization is data-rich, are you actually using your data to create data stories that are benefitting your company’s operations?
By building COO dashboards with carefully selected KPIs, you’ll be generating insights and understandable reports within minutes. Let’s explore what a COO dashboard is and some examples of dashboards that can help COOs take ownership of their operational data.
What Is A COO Dashboard?
A COO dashboard is a data visualization tool that displays KPIs by creating a data story of your metrics. Many modern dashboard solutions like Toucan turn your KPIs into a simplified narrative, rather than throwing a bunch of numbers and percentages on your screen. These dashboards can integrate data from multiple sources, track your KPIs, and optimize your operations.
COO dashboards update KPIs in real-time, ensuring that data is error-free. By eliminating manual processes such as data entry, COOs can be confident in the accuracy of their KPIs. Most modern dashboard analytics solutions like Toucan have hundreds of connectors that import data from your data warehouse, CRM, or point-of-sale systems through cloud technology.
COO dashboards have also evolved with corporate trends. It has become a habit for employees to check their phones multiple times a day to access work updates quickly or when on the go. Modern analytics solutions like Toucan optimize COO dashboards for any device, whether it's your mobile or your meeting room TV.
What Are The Benefits of A COO Dashboard?
A well-planned COO dashboard can add many benefits to a COO's workflow and their organization’s bottom line. Here are some of the perks that a COO dashboard can introduce to your business:

- Autonomous Workflow
You’re a COO of a large retail business and you’ve been experiencing some hurdles with your organization’s data team. The quarter is coming to an end and you need to build a report with updated KPIs. Unfortunately, the IT department’s bandwidth is limited because of company-wide problems with newly acquired software that are impacting hundreds of locations. With a non-technical solution like Toucan, your operations team can build your COO dashboard within minutes without technical help.
- Time Savings
Your organization’s multimillion data stack is organized chaos, and you’re having to reach out to your data team every time you want to create reports. After importing data, you find that it’s difficult to create context that communicates metrics clearly, causing further back and forth between your operations team and data experts. Using an analytics solution like Toucan allows you to import data with one-click integration and create dashboards that provide your audiences with context to make your KPIs more understandable
- Collaboration
As a COO, you communicate with members of the executive board daily. You also collaborate with your senior operations team to make sure everything is running smoothly. Meetings take longer than they should because members of the team are confused with the layouts of the dashboards and overwhelmed with the amount of data present. By building your COO dashboard with a solution like Toucan, you can be sure that all members of your team can provide input during the dashboard-building process and take ownership of the department’s KPIs.
Now that we’ve uncovered the most impactful benefits of a COO dashboard, let’s dive into some concrete examples and the KPIs to include for each.
COO Dashboard Examples
You’re a COO at a large company that manages all aspects of operations, and you think it would be beneficial to build dashboards for each to prevent KPI overload. The idea of building dashboards is overwhelming to you, and you’re trying to compile the most relevant metrics that will drive insights. To help you, we will present 4 examples that cover the three main categories of operational data - finance, logistics, and human resources.
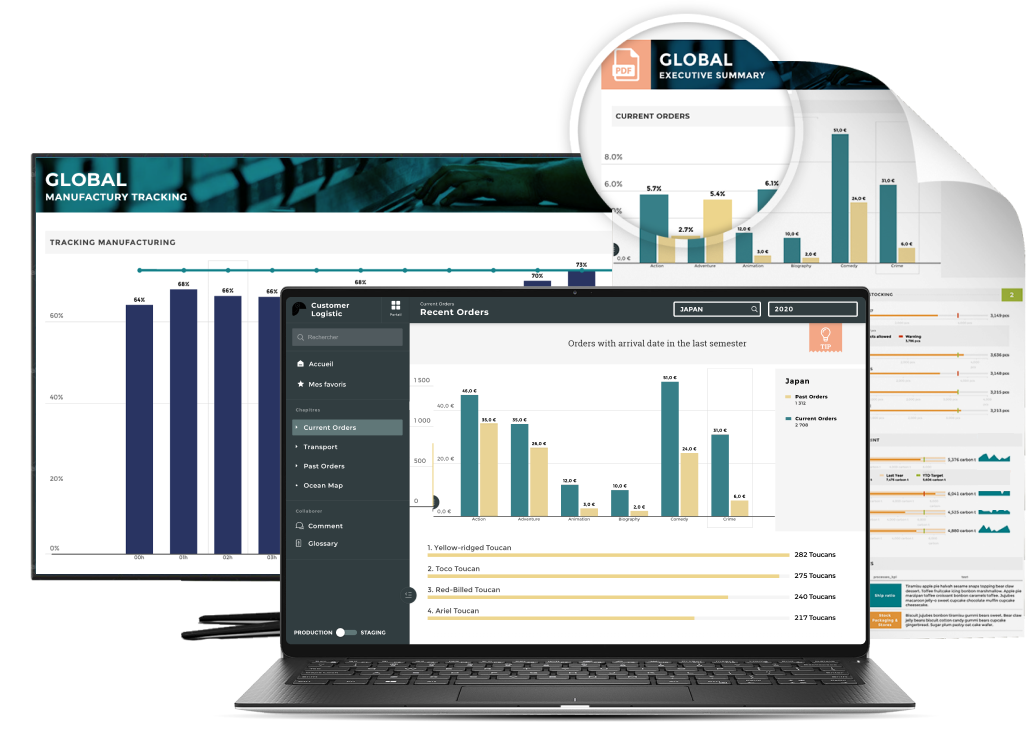
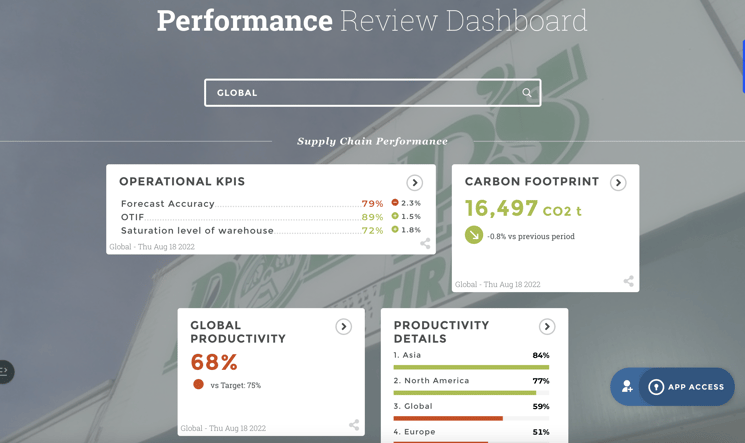
Logistics Dashboard
COOs that manage operations revolving around physical products must keep a close eye on transportation management. Any hiccups in transportation, even minor ones, can derail daily operations and decrease profits. In a world that wants deliveries in a day and expects every product to be on the shelf regularly, transportation mismanagement is costlier than ever. Here is a logistics dashboard that can help you manage the most important transportation KPIs:
Here are the most important transportation management KPIs to include:
- Costs
Whether you have your own fleet or are outsourcing transportation services, it is important to monitor transportation costs to monitor budgetary projections. If transportation costs are higher than expected due to unexpected circumstances, you can quickly pivot and reallocate resources.
- Delivery Time
Shipping and delivery expectations are higher than ever before, with most companies offering same or next-day shipping. Monitoring your delivery times can be one of the most important factors in ensuring that your customers are satisfied.
- Fleet Efficiency
If you have your own fleet, making sure that it is being used to its full potential can help maximize your investment. With a solution like Toucan, you can view how much of your fleet is active in real-time.
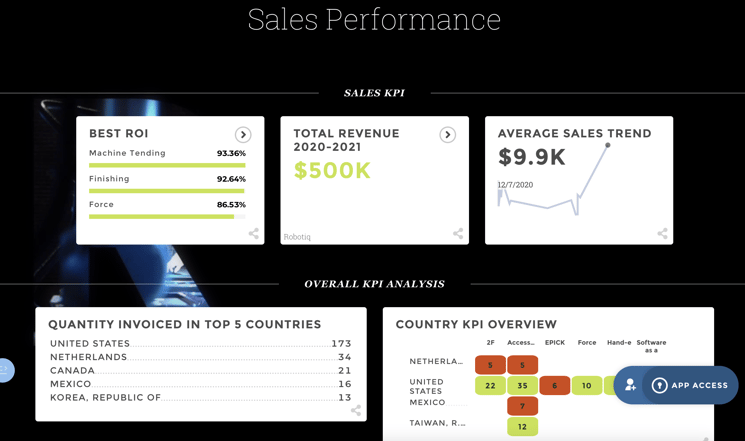
Financial Dashboard
Although CFOs are responsible for an organization’s finances, COOs must also monitor finances to track correlations between operational metrics and financial performance. Because COOs work closely with both the CEO and CFO to ensure that the business’s finances are healthy, a financial dashboard keeps the COO informed and aware of any deficiencies.
Because a COO financial dashboard includes different metrics than a CFO dashboard, it is important to include these KPIs:
- Working Capital
Working capital is one of the top metrics to track for COOs. It tracks the remaining dollars after subtracting current assets from current liabilities. This KPI is perfect for tracking the short-term operational efficiency and financial health of your business.
- Cash Conversion Cycle (CCC)
This KPI is crucial for financial analysis, monitoring how long it takes for a business to liquidate all of its resources. The lower your CCC, the more efficient your operations and management processes will be.
- Current Ratio
This KPI correlates directly with working capital. The current ratio measures the liquidity of your business by dividing your current assets and liabilities. Keeping the current ratio higher than one is the goal, and any current ratio lower than one means that your company may not be able to pay debts in time.
Employee Dashboard
Although high finance metrics and efficient logistics processes are crucial to the success of a COO, employees are the ones who will help them achieve these goals. Because of the importance of employee efficiency to operations, COOs must track employee performance and morale to improve any weaknesses or solve problems.
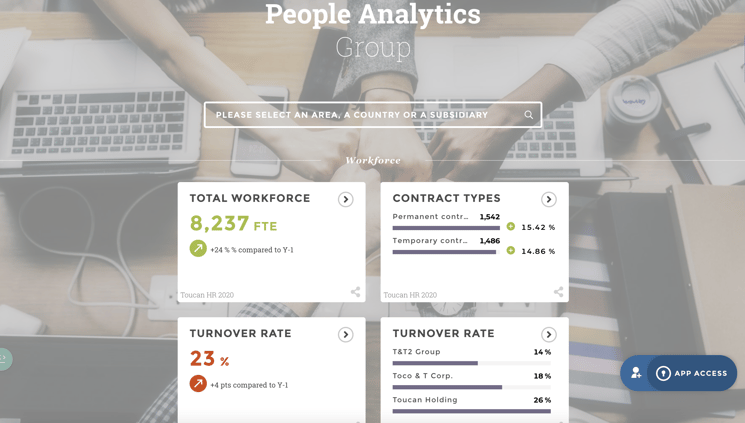
These fundamental human resource management metrics are key to monitoring employee efficiency:
- Training Costs
Keeping employees happy and healthy is a major component of workforce efficiency, and COOs must keep track of training programs. Although it is important to implement a variety of training programs to improve operations, they must be effective and translate to financial success. By cross-referencing training programs with employee output, COOs can see whether their training investments are paying off.
- Turnover
Employee turnover has become a very popular KPI to track over the past year due to fluctuations in the employee market. This metric monitors the number of employees leaving an organization within a given time period. If a COO sees a high employee turnover, they can look into the reasons why employees are dissatisfied with their work environment.
- Overall Labor Effectiveness
This KPI provides a COO with a big-picture overview of employee performance. There are a couple of ways to calculate this KPI, one being dividing your total sales by the number of employees. However, this calculation may be a bit too general as employee output varies across departments. For this reason, setting limits for each department and compiling them into your dashboard may be a better choice for measuring overall labor effectiveness.
Which Solution Should I Use To Build My COO Dashboard?
As an analytics solution geared towards executives with non-technical backgrounds, Toucan builds dashboard applications that are meant to include relevant stakeholders in the dashboard-building process. Too often, executives are handed dashboards and expected to use them seamlessly and end up more confused than insight-rich.
With Toucan, operations teams can build dashboards themselves to ensure that relevant KPIs are included, and COOs can access insights wherever they are, whether it’s on a desktop or mobile device. Applications can be built and deployed within days, and the platform is designed to be 0-code, meaning that executives can go in and make changes on the fly without having to consult their IT departments. Collaboration is also emphasized throughout the application design, with annotation capabilities and comment sections allowing COOs to communicate with relevant stakeholders without leaving the app.
Toucan’s data storytelling focus also ensures that dashboards are laid out to promote insights instead of generating frustration. Each application is designed to display the perfect balance of visualization for clarity and portrays an impelling narrative of your operational KPIs.