When someone mentions the phrase "data warehouse," Snowflake is likely the first name that comes to mind. For the past decade, the firm's innovation has elevated the capabilities of data warehousing, allowing companies to store their enormous data sets in the cloud rather than build server rooms in-house.
Snowflake is a useful tool in any data stack, no doubt about it. The tool’s feature set, track record, and customer base are strong and well-understood in the industry. But what happens after you start storing and structuring your data with Snowflake? If you can’t visualize the lines of data and code stored there, how do those countless meaningless columns turn into insights?
Analytics solutions can answer those questions, connecting Snowflake to dashboards that update in real-time. With an analytics solution that fits your organizational needs, your Snowflake data can turn into vivid data stories used for dashboard building, reporting, and predictive insights. Most importantly, analytics solutions are taking away the gatekeepers from data, giving the non-technical user an opportunity to own their data.
Analytics solutions have caught up to the needs of companies looking to gain a competitive edge. Here are the top analytics solutions that Snowflake users can choose to go from data-rich to insight-driven.
01. Toucan Toco
Who it is made for: Non-technical users
Data level needed: Novice
Unique attribute: Context everywhere

Toucan is a top embedded analytics provider, ranking number one in delivering tangible ROI and meeting customer requirements at scale according to G2. With one-click integration, connecting Toucan to Snowflake is a breeze for the non-technical user. The platform’s mission is to involve non-technical users in data ownership through 0-code functionality.
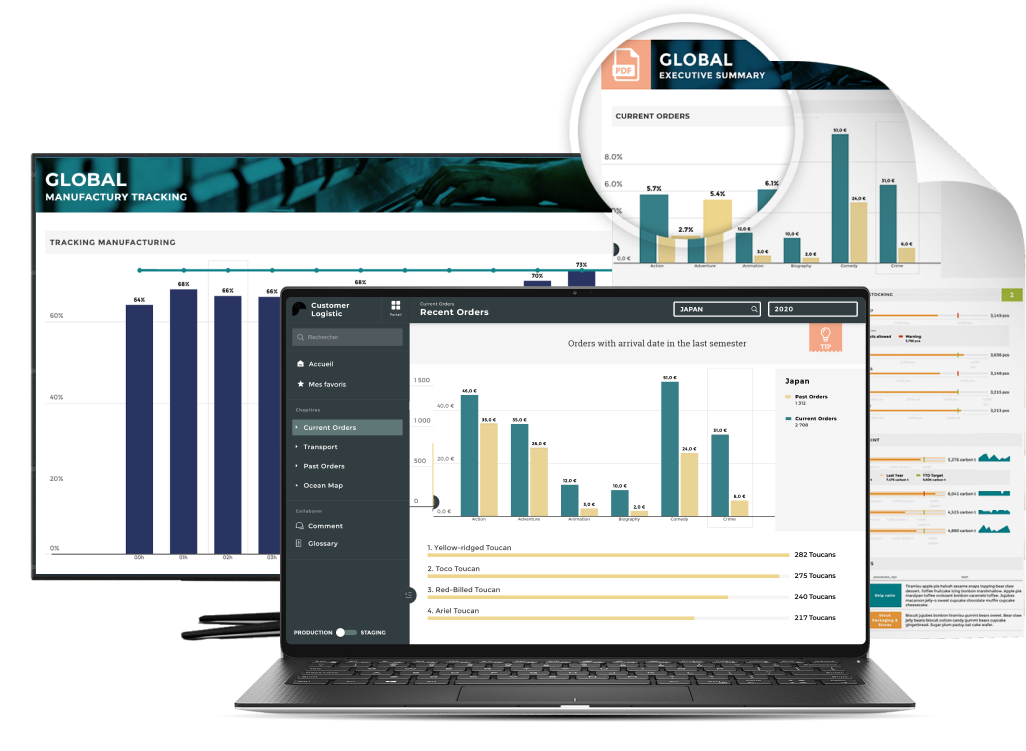
Context is at the heart of Toucan applications through the use of data storytelling and the presence of KPIs, dashboards, and glossary sections to help the non-technical user create a data story of their organization. When importing data from Snowflake to a Toucan application, users’ dashboards can update in real time and are accessible on any device. Because Toucan is 0-code, it is perfect for organizations of all sizes looking to draw insights without hiring a new data team to create visualizations.
Although context is important to Toucan’s UX, collaboration and sharing are emphasized throughout its applications to democratize data at all levels of an organization. Annotation capabilities allow users to make notes and observations within the application and the comments feature allows users to discuss any concerns without leaving the application. The instant sharing of reports, annotations, and visualizations is also supported via email, Slack, and PDF. Toucan’s highly rated customer support team, 9.9/10 on G2, is also on hand to answer questions or resolve any hiccups that may arise during the onboarding and deployment processes.
Toucan is a great Snowflake analytics solution for organizations of any size who are looking to democratize their data. Its 0-code functionality increases the accessibility of data for non-technical users who are looking to retain data ownership.
02. Domo
Who it is made for: Data analysts
Data level needed: Expert
Unique attribute: None

Domo is another business intelligence solution that can layer over your Snowflake data. Domo implements a straightforward connection to Snowflake, but like Power BI, all of the platform’s difficulties arise after your data is imported.
Many users have found Domo to be scattered and difficult to interpret. Users find it difficult to use Domo because the analytics provider is the only one to lock their user guides and onboarding courses behind a paywall, calling this an “onboarding fee.” Domo also charges extra for a generic free trial that does not incorporate specific user requirements. For organizations who want a solution with onboarding included in its pricing and are looking for a solution that will work for technical use cases, Domo is not a good option. Although coding is relatively easy throughout Domo, its navigation and UI make things very complicated, and a user who hasn’t bought the user guide courses will feel hopelessly lost. Domo excludes ad-hoc capabilities from its platform, limiting the benefit of Snowflake's ad-hoc query support.
Domo is a below-average solution to layer on top of Snowflake due to its paywall for onboarding materials, confusing user interface, and lack of ad hoc capabilities. It is a difficult solution to recommend for an organization without a Domo expert or any organization looking for full transparency throughout the demo and onboarding process.
03. Sigma
Who it is made for: Spreadsheet users
Data level needed: Intermediate
Unique attribute: Spreadsheet UX

Sigma is a newer business intelligence offering that offers Excel lovers a more detailed data visualization solution. The platform’s connection to Snowflake is straightforward, and its documentation can be understood by the non-technical user. Sigma’s spreadsheet-like UX makes it a great solution for companies comfortable with using Excel to create reports.
Although companies don’t need a data expert to use Sigma, mastering spreadsheet functions and SQL is necessary to generate insights. The platform advertises some functions as no-code, yet code is required to build custom components for chart adjustments. Sigma’s table-dominated UX may not meet the expectations of a user looking for a solution specializing in data visualization. Spreadsheet functions offer limited functionality for business users, and Sigma lacks the ability to easily explain data to executives and the C-suite. Because of its ability to perform essential functions without code, Sigma is a good fit for a company looking for a bare minimum analytics solution, or for a company with an advanced SQL professional that can use all of the platform’s features.
Many users report significant downtimes and bugs within Sigma, preventing usage at important times throughout the dashboard building process. The solution also lacks more detailed visualizations, manipulation within pivot-type graphs, and dynamic filtering. Sigma’s 150,000-row limitation on exports also limits the platform’s scalability and users often report long load times when manipulating larger data sets.
All in all, Sigma is a great solution for small companies using Excel to generate reports, have an advanced-level SQL professional on their data team, and who aren’t looking to scale.
04. Power BI
Who it is made for: Data analysts
Data level needed: Expert
Unique attribute: Bi specialization

Power BI is Microsoft’s business intelligence offering geared towards enterprises with developed data teams. Connecting Snowflake with Power BI is a fairly simple process, but that’s where the simplicity ends.
Although Power BI’s visualization variety is strong, the platform’s feature set lags behind the competition. Its lack of updates and reliance on M language to construct visualizations creates extra steps and frustrating hurdles, even for data professionals. Although M language is understood by most data experts, the platform’s support team is lacking when users hit a snag. Because of its complexity and proprietary language, Power BI should only be used by organizations with a big budget and experts familiar with the platform.
If you are making the shift from another data warehouse to Snowflake and already have Power BI in your data stack, the solution will satisfy a user’s requirements. Although it has a stable connection to Snowflake, Power BI is a difficult solution to recommend for anyone but an organization with Power BI experts and a big budget.
05. Tableau
Who it is made for: Data architects
Data level needed: Advanced
Unique attribute: Customization

Tableau is a business intelligence solution focusing on data visualization. The platform is gated off from non-technical users and its Snowflake connection cannot be established without code. Tableau’s focus on data architects allows companies to customize their visualizations through complex code at the expense of including the non-technical user.
Tableau is a highly customizable platform, but that customization comes with some drawbacks. Data imported from Snowflake must be coded to create data visualizations using more complex data languages like Python and R. Because Tableau’s support team is limited, users must be confident in their knowledge of the platform and have the ability to troubleshoot any potential issues.
Tableau’s pricing may seem average or even below average depending on the competition, but the hidden costs of using the platform add up. These hidden costs, added to the data team needed to leverage the solution’s features make it more expensive than it appears.
Overall, Tableau is a good enterprise solution for firms that have the data infrastructure necessary to build visualizations through advanced code and the budget to employ data professionals who can troubleshoot complex problems.
Which Snowflake Bi/Reporting Solution Should You Choose?
The analytics solution that you choose will be the one that matches your organizational needs and expectations. Although they all have their pros and cons, your organization may be more equipped to handle some of the challenges these solutions pose. However, when objectively comparing all these solutions, Toucan is the top choice for leveraging Snowflake data to create insights for all business users.
Toucan has everything you would want from a Snowflake analytics solution. By providing context to a non-technical user’s Snowflake data, Toucan allows business professionals from every background to enjoy the benefits of data ownership and democratization. Whether your employees need to view their dashboards in the field or in a company meeting room, Toucan applications can be viewed on any device without the loss of context. By combining context with one-click integration, easy sharing capabilities, and real-time visualizations, Toucan’s data storytelling and 0-code functionality unlock data analytics for everyone.


