This article assumes you are already familiar with Python.
As soon as your code stops being trivial and runs on real-world data volumes, you will run into performance issues. You’ve heard that Python is slow, so it must be the culprit!
Not so fast!
Sure, Python is not compiled to optimized native code (yet) and therefore won’t rival C, Fortran or assembly in tightly nested loops. But most Python performance issues can be alleviated by improving the algorithm or using the right tool for the job. Read on to learn how.
Profiling
Finding out why your program is slow by looking at its source code is a waste of time. It’s extremely hard to guess where a complex program is spending its time by just looking at the code.

Even trivial code like the example below might be a puzzle:
"""Sorting a large, randomly generated string and writing it to disk"""
import random


def write_sorted_letters(nb_letters=10**7):
    random_string = ''
    for i in range(nb_letters):
        random_string += random.choice('abcdefghijklmnopqrstuvwxyz')
    sorted_string = sorted(random_string)

    with open("sorted_text.txt", "w") as sorted_text:
        for character in sorted_string:
            sorted_text.write(character)

write_sorted_letters()
The obvious bottleneck has to be the disk access, right? Well…
Let’s not guess and instead use a program to know exactly what’s going on in your program at runtime. That kind of program is called a profiler, and it will save you time on trial and error optimization. A profiler is a handy tool that will automatically time and count each execution of each piece of your code. Your first reflex must always be to profile your code before trying to guess which part to optimize.
Whole program profiling
Any IDE worth its salt will have an integrated profiler ready to launch at the click of a button.
In the command line however, you must run your whole program inside the profiler, like this:
python -m cProfile -s tottime your_program.py
This will run your program unchanged, and then display the profiling’s result as the table below:
         40000054 function calls in 11.362 seconds

   Ordered by: internal time

   ncalls  tottime  percall  cumtime  percall filename:lineno(function)
 10000000    4.137    0.000    5.166    0.000 random.py:273(choice)
        1    3.442    3.442   11.337   11.337 sort.py:5(write_sorted_letters)
        1    1.649    1.649    1.649    1.649 {sorted}
 10000000    0.960    0.000    0.960    0.000 {method 'write' of 'file' objects}
 10000000    0.547    0.000    0.547    0.000 {method 'random' of '_random.Random' objects}
 10000000    0.482    0.000    0.482    0.000 {len}
        1    0.121    0.121    0.121    0.121 {range}
        1    0.021    0.021   11.362   11.362 sort.py:1(<module>)
...
These results are sorted by total time usage for each element (That’s where -s tottime comes from).
Which means that you really want to start optimizing those big time wasters at the top first!
So here, looking at the tottime column, it looks like the choice function from random module takes almost a third of our total run time.
This is clearly where we must focus our optimization efforts.
But before we jump into optimizing, let’s dive a little bit deeper into profiling.
Targeted profiling
Note that the command above will profile your whole program. If you want to be more precise, you could surround the pieces of code you’d like to profile between
import cProfile
cp = cProfile.Profile()
cp.enable()
and
cp.disable()
cp.print_stats()
The resulting table will look similar to the one above, but won’t contain unneeded profiling information from other part of your code.
Since it’s hard to tell where your program spends its time, you should start by profiling your program entirely before narrowing down the profiling to a single section.
More info on the cProfile and Profile modules here.
Line profiling
Sometimes the profiler may lump together methods calls from different parts of your code, or just won’t be precise enough.
In that case, you may want to profile your program line by line, so you’ll know precisely where to focus your optimization efforts.
To do that, first, install the line_profiler tool by running the following command:
pip install line_profiler
Then, modify your code and decorate each function that you want to profile with @profile. Let’s decorate our function so it will look like this:
@profile
def write_sorted_letters(nb_letters=10**7):
    ...
You can then run your program through the line profiler like this:
kernprof -l -v your_program.py
-lfor line by line profile-vfor immediately visualizing the results
The result should look like this:
Total time: 21.4412 s
File: ./sort.py
Function: write_sorted_letters at line 5

Line #      Hits         Time    Per Hit   % Time  Line Contents
================================================================
     5                                             @profile
     6                                             def write_sorted_letters(nb_letters=10**7):
     7         1            1        1.0      0.0      random_string = ''
     8  10000001      3230206        0.3     15.1      for _ in range(nb_letters):
     9  10000000      9352815        0.9     43.6          random_string += random.choice('abcdefghijklmnopqrstuvwxyz')
    10         1      1647254  1647254.0      7.7      sorted_string = sorted(random_string)
    11
    12         1         1334     1334.0      0.0      with open("sorted_text.txt", "w") as sorted_text:
    13  10000001      2899712        0.3     13.5          for character in sorted_string:
    14  10000000      4309926        0.4     20.1              sorted_text.write(character)
First, note that this profiling tool is slowing down our program almost twofold, from 11 seconds to 21.
But there is an upside: we have our program on the right hand side and can see which lines are impacting the performance of our application and how much so.
OK, grandpa profiling is cute, but how about realtime continuous web application profiling?
The integrated profiler is simple enough and can get you where you want in terms of performance for single-thread, local workloads. But a large, threaded, web application is a whole different beast.
Let’s have a look at the awesome Profiling module.
First, install it with sudo pip install profiling, then run your program through it: profiling your_program.py. Don’t forget to remove the @profile decorator that will only work with the line_profiler.
It gives us a detailed tree-like view of the profile at the end of the program’s run:
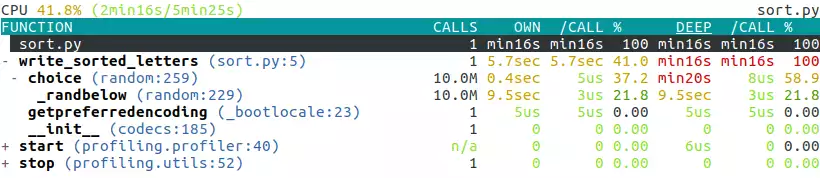
It’s interactive so you can navigate and fold/unfold each line by using the arrow keys.
There is also a live mode for long running processes such as web servers. You can invoke it like this: profiling live-profile your_server_program.py. You can interact with it as your program is running to explore your program’s performance profile as it runs.
Profiling resources
Optimizing
Now that we know where our program spends our precious CPU cycles, we can optimize accordingly.
A note of warning
You should only ever optimize when and where necessary, since the resulting code will often be harder to read and maintain than “slow” code.
Optimizing is trading maintainability for performance.
Numpy to the rescue
So, it looks like this random.choice function is slowing us down…
Let’s replace it with a similar function from the famous numpy library. The arguments to this function are slightly different from random.choice, so the code now looks like this:
"""Sorting a large, randomly generated string and writing it to disk"""
from numpy import random


def write_sorted_letters(nb_letters=10**7):
    letters = tuple('abcdefghijklmnopqrstuvwxyz')

    random_letters = random.choice(letters, nb_letters)
    random_letters.sort()

    sorted_string = random_letters.tostring()

    with open("sorted_text.txt", "w") as sorted_text:
        for character in sorted_string:
            sorted_text.write(character)

write_sorted_letters()
Numpy is a set of powerful and fast numerical functions that are compiled to native code. It’s also making use of parallel processing when possible.
You can install it by a single command: pip install numpy
So let’s run our new program through profiling to see the improvement:
         10011861 function calls (10011740 primitive calls) in 3.357 seconds

   Ordered by: internal time

   ncalls  tottime  percall  cumtime  percall filename:lineno(function)
 10000000    1.272    0.000    1.272    0.000 {method 'write' of 'file' objects}
        1    1.268    1.268    3.321    3.321 numpy_sort.py:5(write_sorted_letters)
        1    0.657    0.657    0.657    0.657 {method 'sort' of 'numpy.ndarray' objects}
        1    0.120    0.120    0.120    0.120 {method 'choice' of 'mtrand.RandomState' objects}
        4    0.009    0.002    0.047    0.012 __init__.py:1(<module>)
        1    0.003    0.003    0.003    0.003 {method 'tostring' of 'numpy.ndarray' objects}
...
Nice! Our new program is almost four times faster than the previous version (3.3 seconds vs 11.362 seconds).
If we look at the total time column again, we now see that the write operation is slowing us down the most.
Let’s fix that by replacing:
with open("sorted_text.txt", "w") as sorted_text:
    for character in sorted_string:
        sorted_text.write(character)
with:
with open("sorted_text.txt", "w") as sorted_text:
    sorted_text.write(sorted_string)
This avoids writing to disk character by character, and instead write the whole string at once, making use of the disk cache and buffers to speed up file writing.
Let’s simply time our new program to see the end result:
time python your_program.py
Which gives us:
real 0m0.874s
user 0m0.852s
sys  0m0.280s
Now our program that used to take more that 11 seconds is running in less than a second! Ain’t that wonderful?
Other performance tricks
Keep in mind these latency numbers in a computer:
 Latency Comparison Numbers
--------------------------
L1 cache reference                           0.5 ns
Branch mispredict                            5   ns
L2 cache reference                           7   ns                      14x L1 cache
Mutex lock/unlock                           25   ns
Main memory reference                      100   ns                      20x L2 cache, 200x L1 cache
Compress 1K bytes with Zippy             3,000   ns        3 us
Send 1K bytes over 1 Gbps network       10,000   ns       10 us
Read 4K randomly from SSD*             150,000   ns      150 us          ~1GB/sec SSD
Read 1 MB sequentially from memory     250,000   ns      250 us
Round trip within same datacenter      500,000   ns      500 us
Read 1 MB sequentially from SSD*     1,000,000   ns    1,000 us    1 ms  ~1GB/sec SSD, 4X memory
Disk seek                           10,000,000   ns   10,000 us   10 ms  20x datacenter roundtrip
Read 1 MB sequentially from disk    20,000,000   ns   20,000 us   20 ms  80x memory, 20X SSD
Send packet CA->Netherlands->CA    150,000,000   ns  150,000 us  150 ms
Taken from Latency Numbers Every Programmer Should Know
Optimizing resources
- Python performance tips
- Numpy
- Numba is an effort to speed up Python code through the use of JIT (just in time) compilation and even GPU hardware.
- Anaconda is a commercial package that regroups Numpy, Numba and many other packages oriented towards data science and numerical computation.