


The Key Product Management KPIs to Track
.png?width=88&height=88&name=portrait_agathe_face%20(1).png)
Agathe Huez
Publié le 02.09.22
Mis à jour le 13.01.26
6 min
Product managers serve one of the most important roles in any organization, analyzing customer needs, monitoring the market, and tracking financial metrics. These tasks all require KPI tracking. This modern-day influx of metrics and data to analyze often leaves product managers frustrated by not being able to pinpoint the source of a problem with product development.
This data headache doesn’t happen by accident, and the 25% of employees that actively use a data analytics solution eliminated one of the factors that lower adoption rates - KPI overload.

Choosing the right KPIs for your product manager dashboard will simplify your data analytics experience. The saying more is better doesn’t apply to dashboard building, and we recommend about 7-10 KPIs per dashboard to avoid an illegible and ineffective dashboard. Here are the 7 most important product manager KPIs that make up an efficient product manager dashboard.
The 7 KPIs for Every Product Manager’s Dashboard
Picture this. Jessica is a product manager that has a problem with customer satisfaction for a popular product and is looking for a solution. She’s sure that the relevant KPIs are somewhere on her dashboard, but she spends 20 minutes looking for them and still doesn’t find the ones she needs. Obviously, Jessica is frustrated and doesn’t want to use her data analytics because she doesn’t draw any insights from them!
We’ll use Jessica as an example to show that achieving adoption is possible when tracking and displaying product-centric KPIs. She has 3 areas to address on a daily basis: customer satisfaction metrics, product metrics, and engagement metrics. Finding the right balance will vary depending on your organization's focus, but these are the most essential KPIs our product manager will track. She tracks these KPIs on a well-organized Toucan dashboard, which increases insights and saves her valuable time when displaying them.
Customer Satisfaction Metrics
Do customers find your product desirable? Are they happy or dissatisfied with specific features?
Our product manager sees a recent uptick in support tickets for her product. She needs to find the specific reason behind this increase to quickly diagnose and solve any problems with product satisfaction, which could put her entire organization on the back foot. Jessica found that the best way to monitor satisfaction KPIs was to build a dashboard dedicated to customer satisfaction metrics that she and other departments could easily track on any device, anywhere.
- Net Promoter Score (NPS)
NPS is a metric that provides product managers with direct feedback about customers. It is a metric that revolves around the answer to the question “How likely is it that you would recommend [brand] to a friend or colleague?” By placing these surveys on their website, review sections, and paid ads, product managers can see what their customers think about their products.
NPS ranks from 1-10 with 1 being the lowest. Detractors rate a product a 0-6, neutrals rate it at a 7-8, and supporters at 9-10. To calculate the metric, subtract the number percentage of detractors from the percentage of supporters. Although NPS is not the most reliable metric due to a fair share of non-reliable submissions, it can confirm problems with customer satisfaction. The metric’s creator, Bain and Company, claim that a positive NPS can be responsible for as much as 20-60% of organic growth, while a negative NPS can imply negative economic consequences for an organization.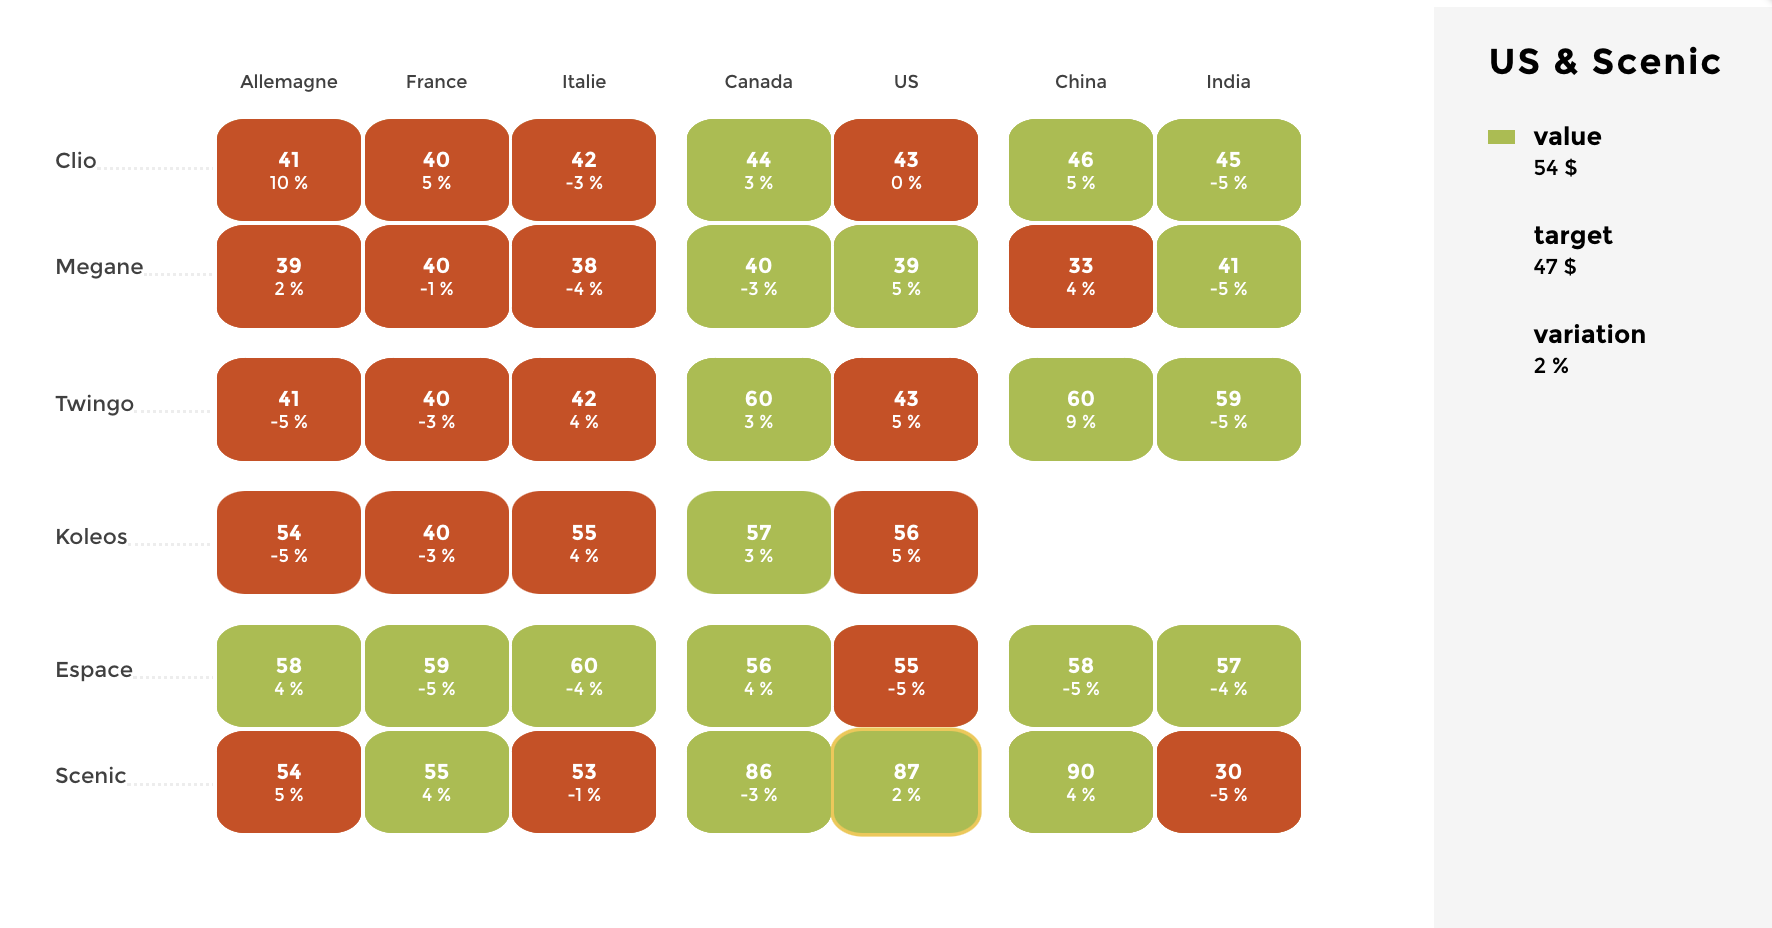
With Toucan, our product manager can easily display NPS on any display when she meets with her customer team, whether remotely or in the company meeting room. The customer success team appreciates the uniformity of their meetings, whether they are working from home, or in the meeting room.
- Customer Satisfaction Score
Unlike NPS, a CSAT score measures a customer's satisfaction with specific features or aspects of a product. Product managers most often insert customer satisfaction surveys when customers renew a subscription, return a product, or through paid survey placement. An organization can provide customers with a rating scale of 1-3, 1-5, or even 1-10 to measure their satisfaction with a specific aspect of the product. To calculate this metric, sum the total score and divide it by the number of participants to find your average CSAT.
Engagement Metrics
Do potential customers find your product desirable? How are they interacting with your content and product promotions?
Our product manager has a dilemma. She knows that her company has a superior product, but its main competitor is doing a better job engaging its audience across media platforms. She knows engagement is a weakness, and she decides to build an engagement metrics dashboard to monitor website and content performance. Because she is working in close collaboration with the marketing team to solve her engagement problems, she knows collaborative capabilities are a must when monitoring engagement KPIs.
- Daily Active User/Monthly Active User Ratio
This KPI is most useful for product managers who are at a SaaS company or monitor a subscription-based product. A daily active user is defined as someone who has logged into a service or application and performed a defined task, and a monthly active user is the same within a monthly period.
This KPI is applicable for websites, mobile games, social media, and all other web-based applications. By viewing how many paying customers are using your platform, you can plan for dips in lower-performing months, work on ways to improve, and compare your daily active users with your CSAT to find correlations between features and engagements.
Our product manager meets with the marketing team on a regular basis to monitor adoption rates and strategize how to improve them. In these meetings, Toucan’s collaborative features allow both parties to annotate and comment about the company’s active users across channels without leaving the application.
- Traffic (paid and/or organic)
Although traffic is considered a marketing KPI, product managers must be aware of their website and content effectiveness. By tracking the traffic to certain product pages, marketing collateral, and calls to action, product managers can collaborate with an organization’s marketing team to bring awareness to an underperforming offering. Measuring paid traffic also helps determine where to allocate more marketing efforts and resources.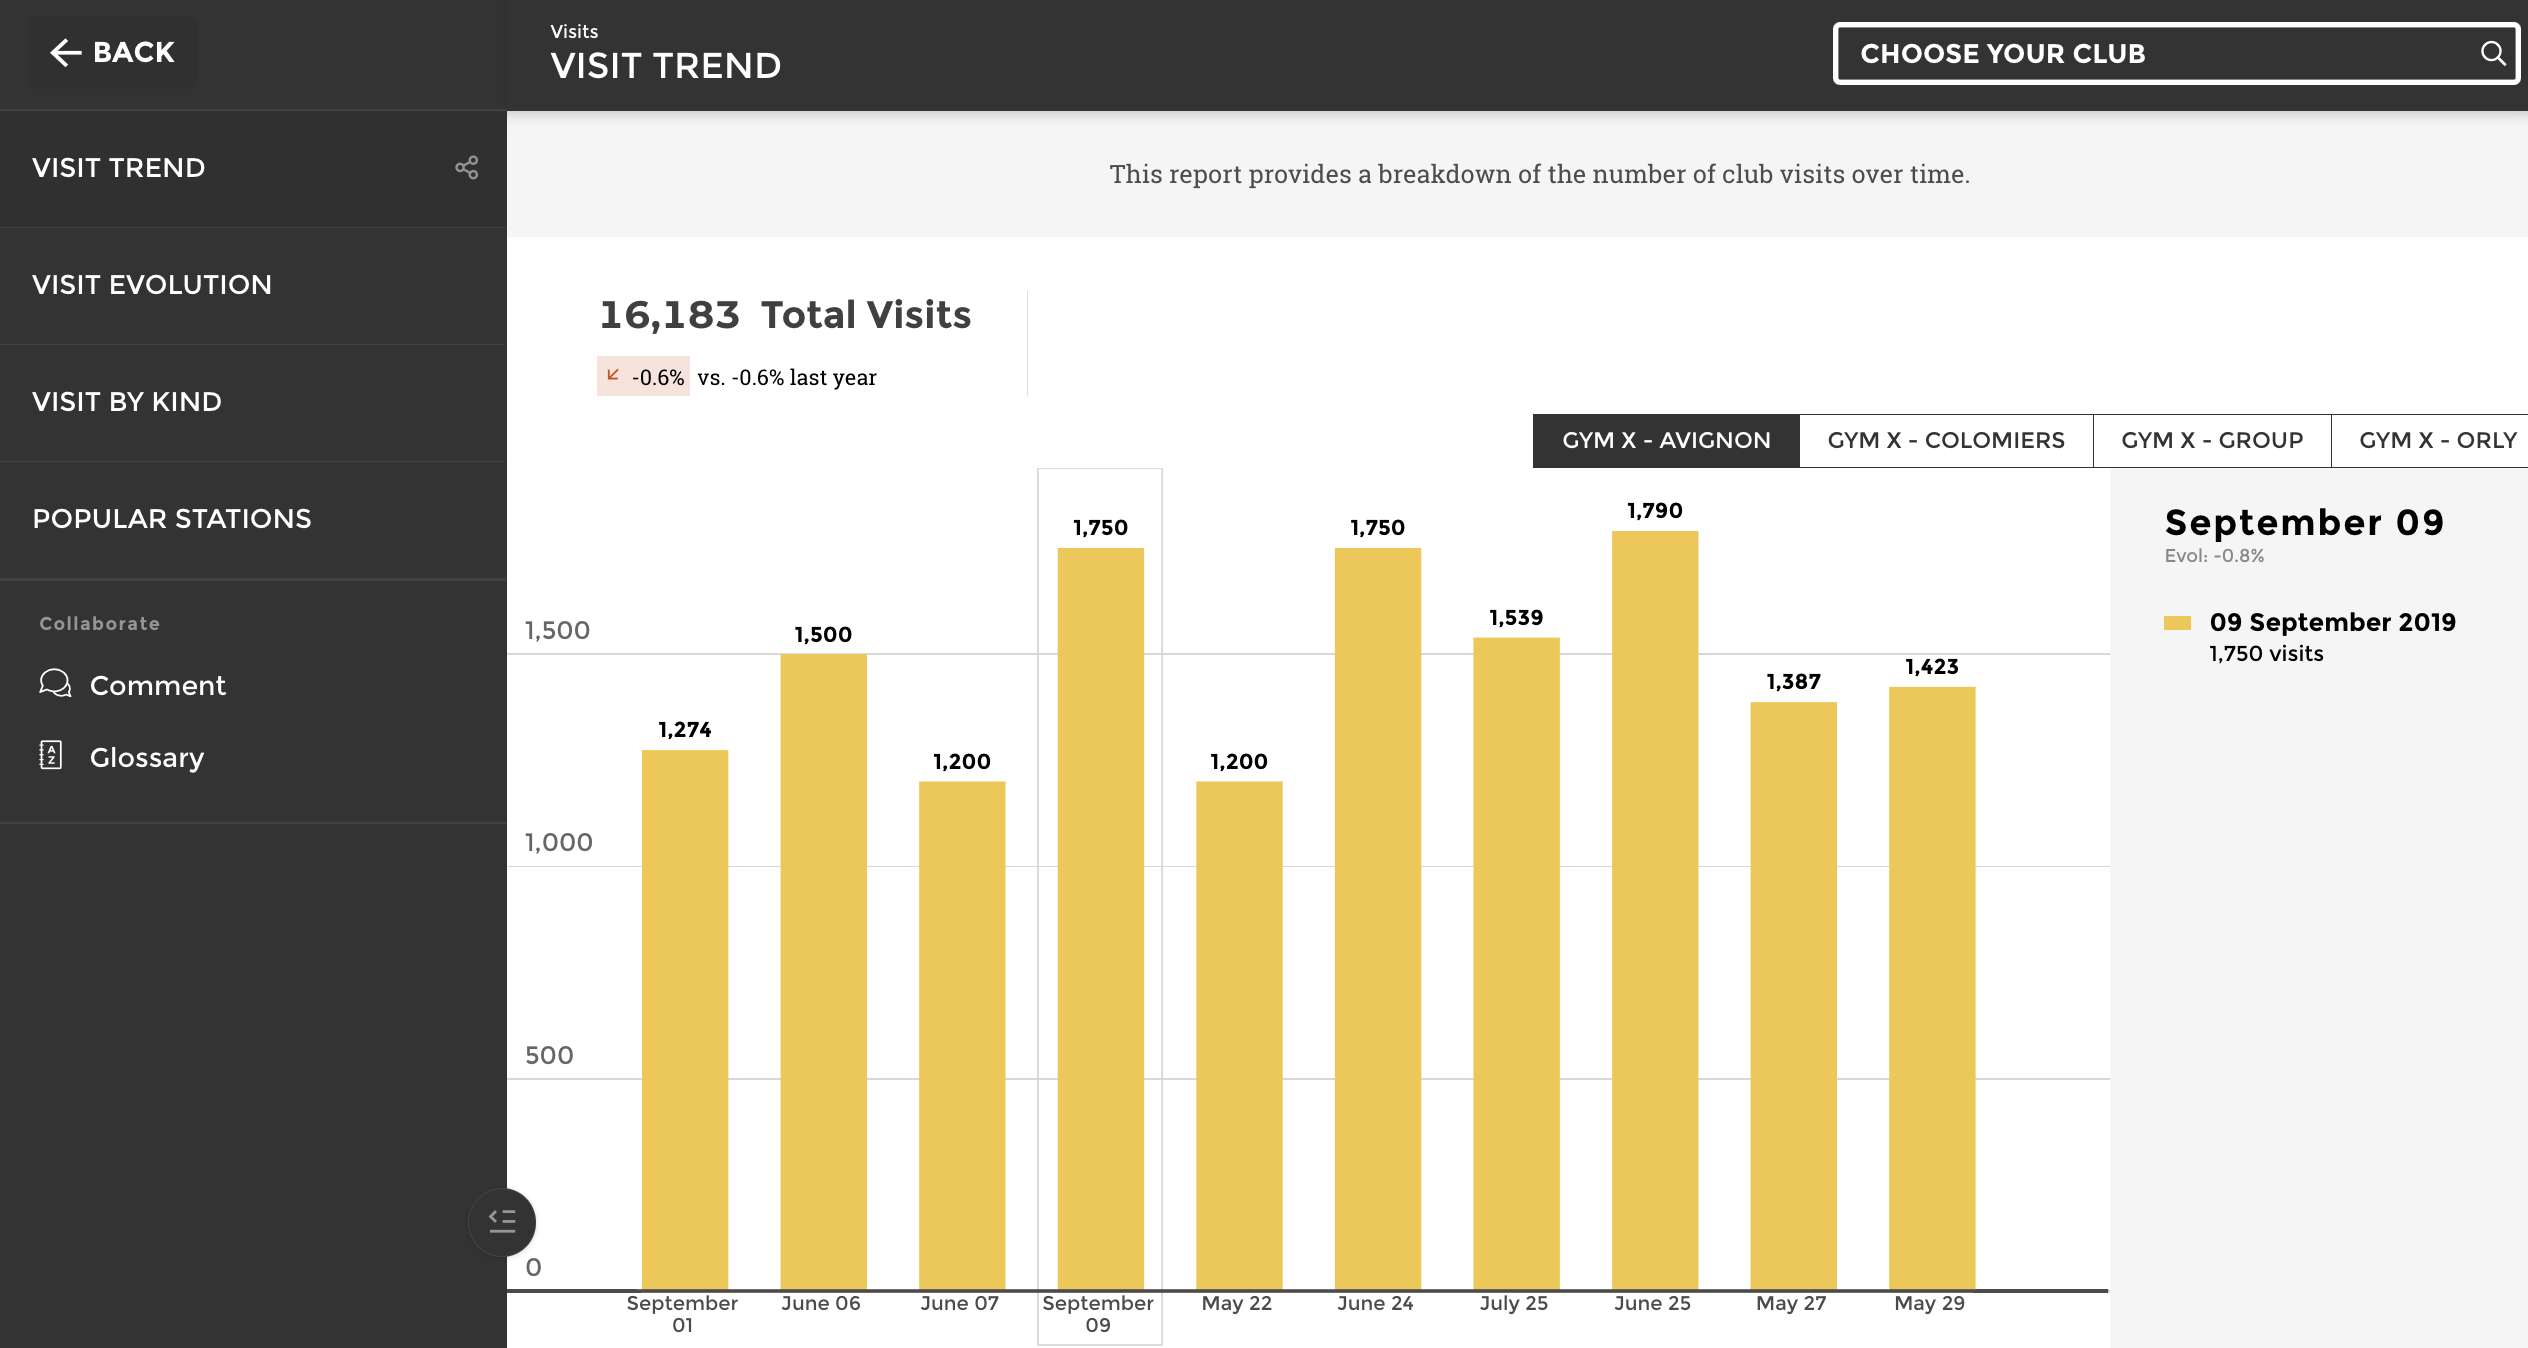
- Bounce Rate
As a KPI that relates to traffic, bounce rate is a measure of how long a customer interacts with an application or website. It is usually measured as the percentage of users who visit only one page or perform a single activity and leave. Bounce rate allows product managers to track user behavior and what keeps them engaged.
Product Metrics
How is your product performing financially? Are you where you need to be in your product’s lifecycle?
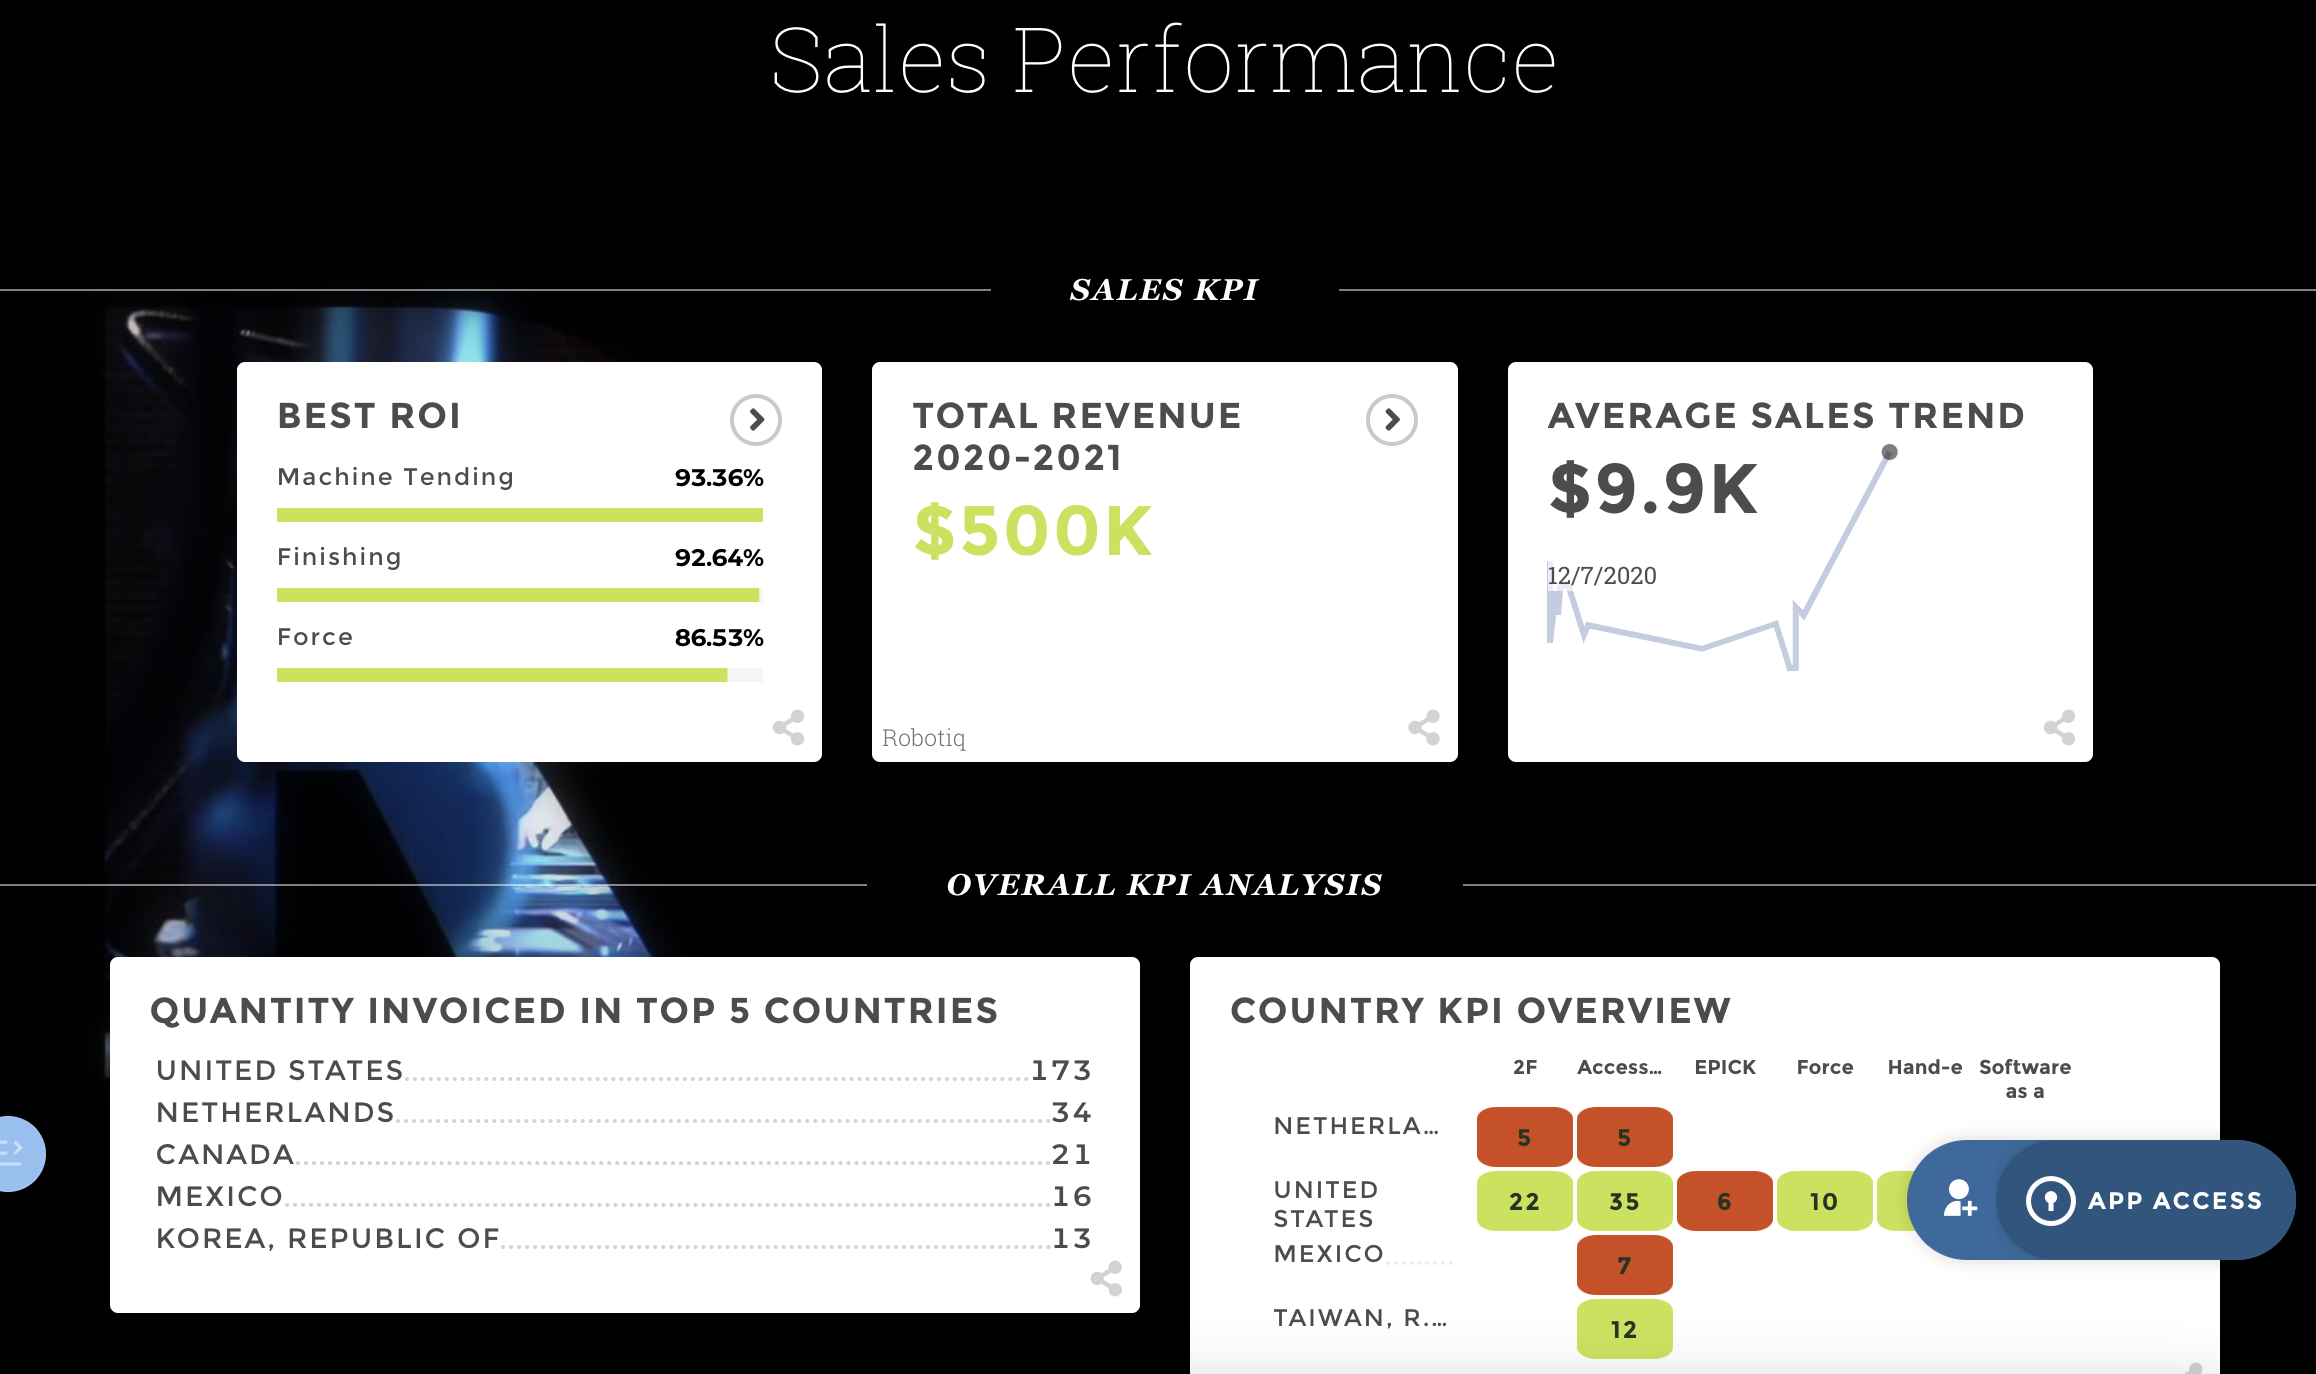
Jessica’s company is having a down month financially, and her products are not performing up to projected goals. She is working with the sales team to find ways to get back on track and the two teams decide to build a finance dashboard around her product performance. She knows that financial KPIs require clear and concise visualizations to reduce confusion, and uses her solution’s color-coding capabilities and glossary page to improve KPI readability.
- Monthly Recurring Revenue (MRR)
A KPI largely used for subscription-based companies, MRR tracks a product’s total revenue on a monthly basis. MRR is a shorter-term KPI that allows product managers to view their subscription metrics on a monthly basis, making it useful for tracking the success of product launches and update. Calculating MRR is straightforward, just multiply the number of monthly subscribers by the average revenue per user.
Our product manager carefully analyzes each month’s MRR to gain maximum insights and build predictive models. She presents this KPI to the sales team on a monthly basis to align the two departments. By setting limits on her visualizations to automatically color change depending on performance, our product manager and sales team know exactly which KPIs to discuss.
- Time to X
This KPI can be effective to measure how users interact with performing transactions or engaging with product features. Usually expressed as a percentage of a previous completion period, product managers can observe how eager users are to access certain products and what features or products they are most drawn to. A lower Time to X when using certain app features may signal that it needs to be updated or overhauled.
Because Time to X can be vague and the name is non-descriptive, our product manager decides to use Toucan’s glossary feature to provide an example of the KPI. Jessica is confident that the sales team will understand Time to X and how it is defined internally.
How Should You choose And Display Your Product Manager KPIs?
Our product manager’s data workflows can only increase adoption throughout her organization. The sales, marketing, and customer success teams appreciate the concise format of meetings, and our product manager easily monitors and defines all of her KPIs. These changes, although they seem small, make all the difference.
Although these KPIs are some of the most important to monitor, you will choose the KPIs that most closely align with your most pressing goals, product positioning, and customer needs. However, the way you display these KPIs matters, and an ineffective product manager dashboard almost always results in poor performance and low adoption.
Using an analytics solution like Toucan to build your product manager dashboard can simplify your product management KPIs through fast app deployment and easy visualization building. With a focus on insights for the non-technical user, Toucan ensures that your KPIs tell an easily understandable story of your product lifecycle, including features like annotations, glossary pages, and automated color coding.
Product managers can also use Toucan’s applications to display KPIs on any display. Whether you’re in a meeting room, traveling to an event, or on vacation, you can always track your product’s success. With Toucan, Jessica goes on her data journey confident in her solution and its ability to clearly display her product metrics.
.png?width=710&name=CTA%20Template%20%E2%80%94%20Free%20Trial%20(2).png)
.png?width=112&height=112&name=portrait_agathe_face%20(1).png)
