From experience, acquiring BI Tools within an organization requires an army of consultants. They come in for a few months, call on a bunch of meetings, do their expertise work on the side, and come back to you with a big Word document for you to take over. You have no idea how they did it, you cross your fingers that nothing goes wrong and you didn’t miss anything during the months of business requirements.
Being a consultant myself for years, I couldn’t help thinking “why using this software is so complicated and not user-friendly”. Honestly hiking the Hawaiian Napali Coast was easier than trying to make the software do what I wanted…
Remember this old saying, “Give a man a fish and you feed him for a day; teach a man to fish and you feed him for a lifetime.”? At Toucan we truly believe in this. We want to make you autonomous in your dashboarding needs and have fun doing it!
Let me tell you how we succeed to install a data-driven strategy in just 4 points:
1. Give your team tools that they can really use
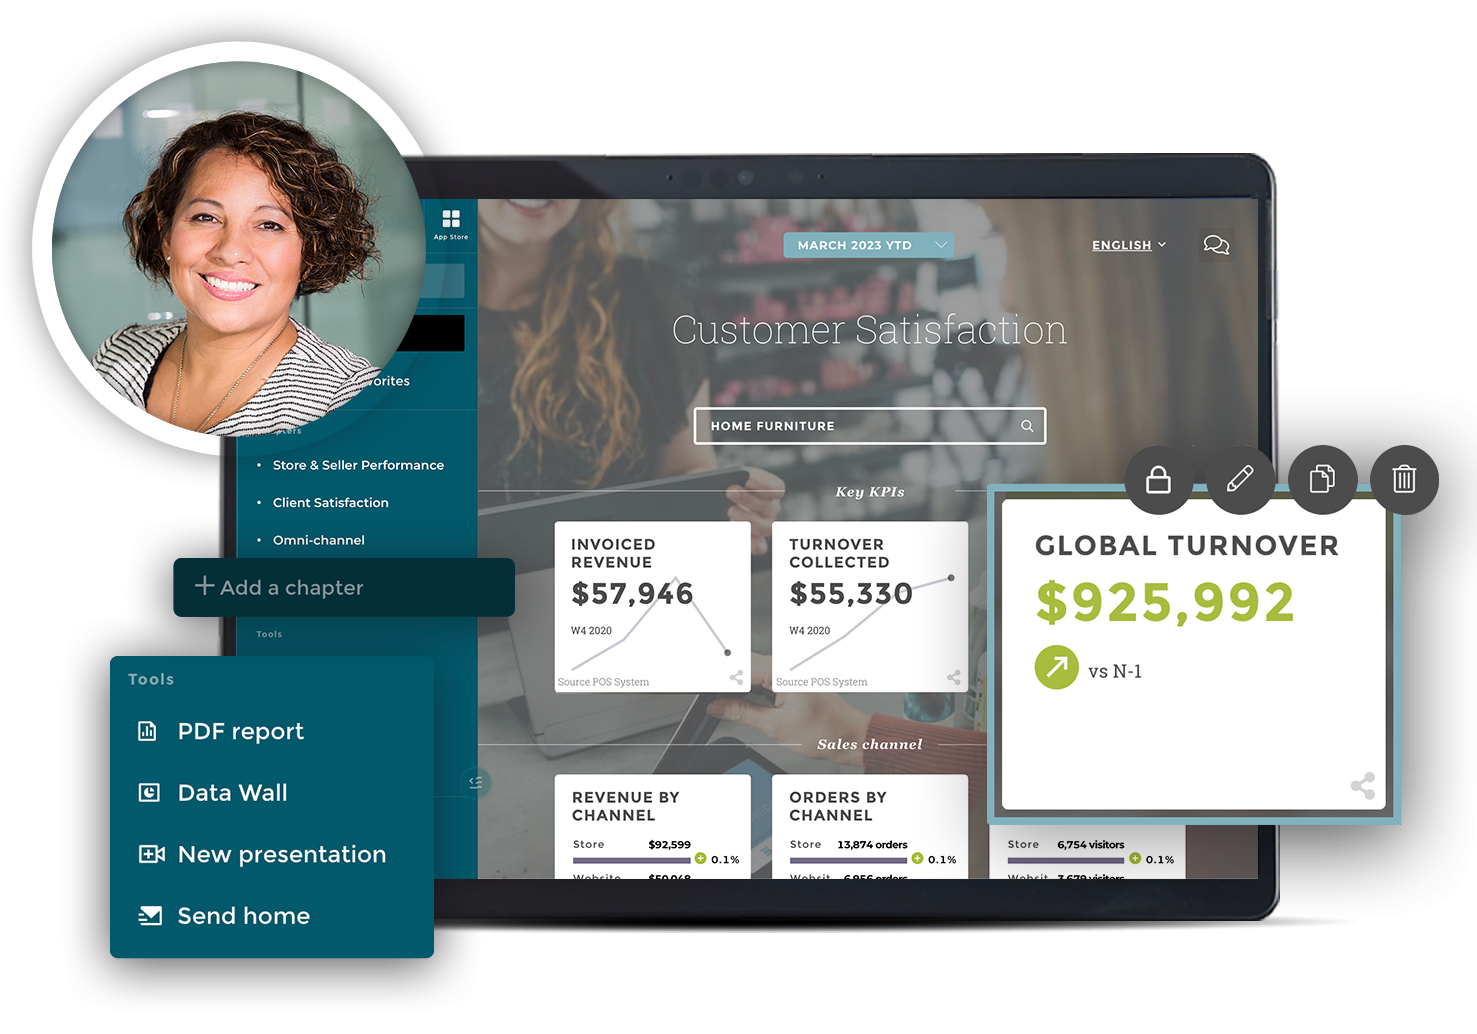
With the Toucan Toco Studio, you create charts and awesome stories with no technical skills required.
Our expertise in data visualization and design allowed us to create an intuitive tool to design a dashboard easily and quickly. Just follow the instructions to get meaningful insight from your data.
Our awesome playground offers you a guided framework for your storytelling. Add context or create viz in just a few clicks. The Toucan Toco Studio is a self-learning tool to make your team autonomous.
Also, get a live preview and results of all of your actions. See what you’re doing! If something goes wrong, you’re safe with our contextual error messages. Never get stuck.
Actually, with our Trial Scenario, we believe that any business user can create his/her very own data storytelling application in about 2 hours. Try it yourself, and request a Studio demo from our website.
2. Set an easy data comprehension mode
Pronouncing the word data can sometimes cause people to faint or put themselves in an “it’s too complicated for me” type of position. Data is just raw information that is dying for attention and care. Within Toucan we provide tools to help you understand your data.
Align with business needs through fast prototyping. You always have new requests from business users about creating new reports or dashboards so you have to be quick to create them. What takes time when you want to create an app? Connecting the data. That’s why we have created a Design-first mode. Only care about the story you want to tell and we take care of generating fake data for you.
Draft your stories with your business stakeholders first to define clear data needs. Stakeholders will be able to play with a live version of the app before working on the industrialization. MVP and iteration is key for user adoption. With our Design-first mode create a fake data model and save time for your IT or data department. Align business needs and technical requirements in no time.
Connect easily to your remote databases with our Data connector interface. In just a few click create your own data sources or use your organization’s library.
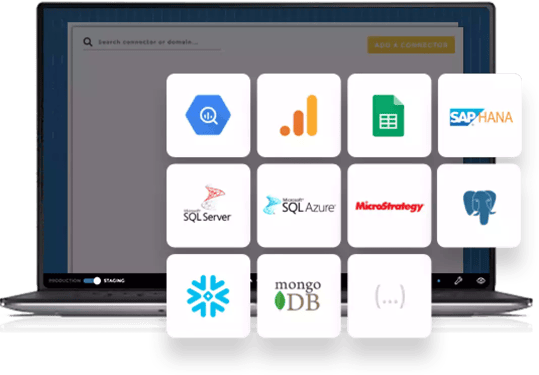
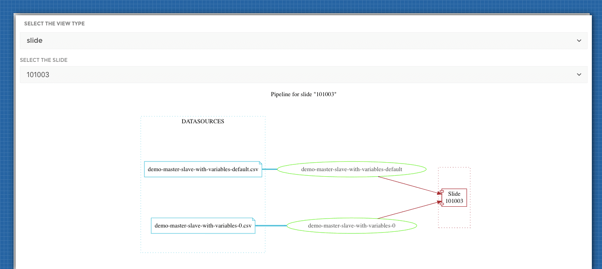
Quickly, understand where the data you’re seeing on your mobile is coming from and how it’s manipulated. With our Pipeline explorer, it’s like having a map and a compass.
Data can be a nightmare to collect, it’s hard to communicate clearly your needs to an often overwhelmed data team or IT department. With our Design First! approach, create a fake data model to ease communication between teams. Make IT love working with you.
3. Rely on a methodology proven by many companies
At Toucan we love sharing our knowledge. Our two main values are Each-one-teach-one and writing the manual.
We are curious and have thirst for new experiences: cross-knowledge is essential for our creative process. This goes along with our community of Data Storytellers, the app builders.
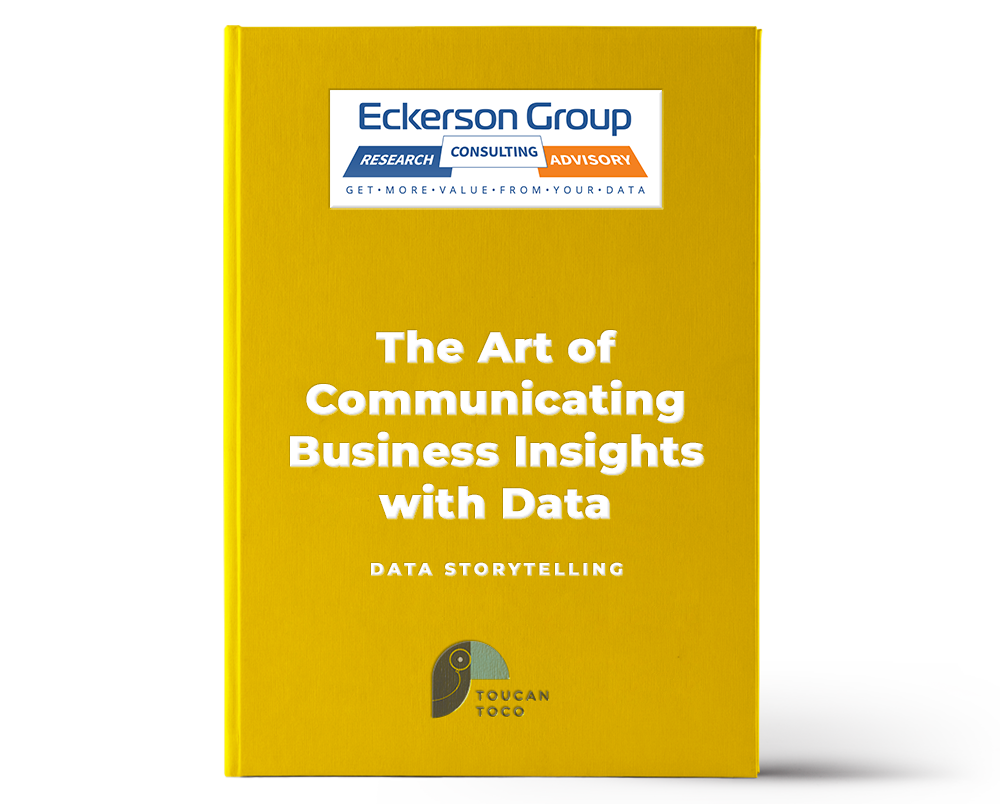
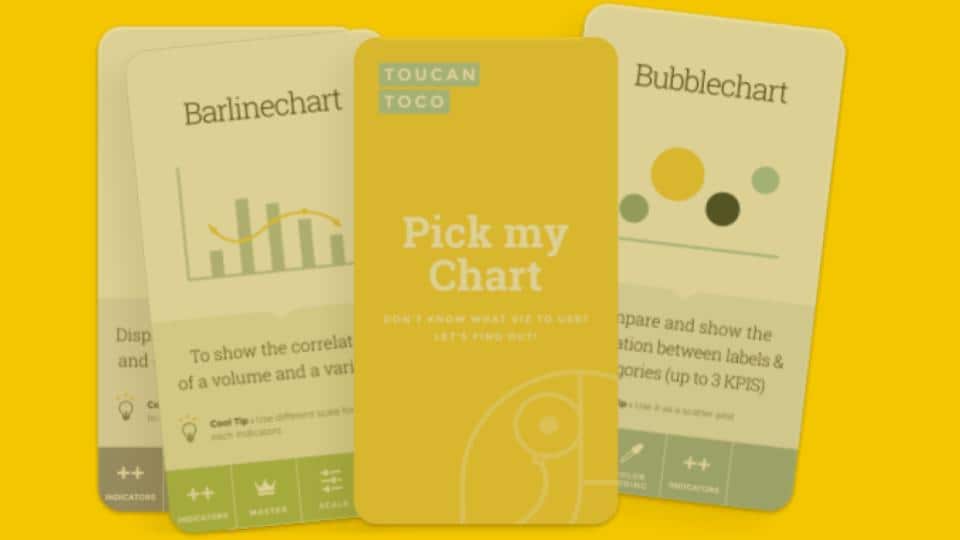
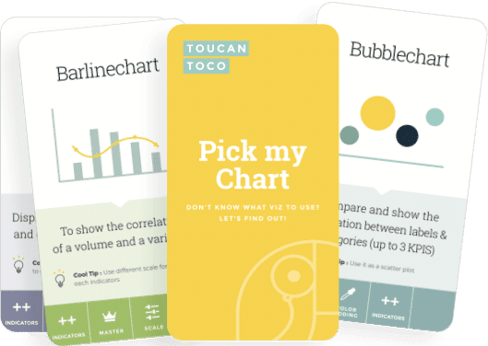
To make you autonomous, we do everything to share with you our experience in project management and our expertise in data storytelling. With the Designer Book, Pick my chart card deck, and our extensive documentation, everything we know is available to you.
By joining our community you will have access to an online support platform, weekly product announcements, focused workshops and more.
Do you want to have a peak? Look at our Waterfall Tutorial, and see how easily you can create one of the most sophisticated charts.
4. Align your teams with a common vision of data
The adoption of a tool is key for end-users. With our easy deployment process, we make you autonomous to decide the right time to equip your teams. But don’t worry, you’re never alone, our team will be there every step of the way.
With your mobile-ready solution, enhance rapidly the daily basis of your collaborators. Everything you build will be accessible from their pocket on a way to a meeting or on their tablet on the train in no time.
With a fast time-to-market approach, get your application quickly into the hands of your teams. Collect feedback and adjust your data storytelling. With Toucan Toco you’re fully autonomous to take your tool to the next level. Start small, go big! Scaling becomes a no-brainer.
Knowledge and understanding are the keys to success. Who’s better than the business users themselves to create the most adequate data storytelling? Use agile tools and agile methodologies to empower your teams.
Introduce change that you can scale, control and own with your existing resources.
With Toucan, you’ll learn the skills to make the switch and become a data-driven organization all by yourself!

.png)