Data-driven decision-making refers to the process of making business decisions solely on the basis of observable data, including internal policies and broad strategic directions. Cross-organizational data collection processes are established as part of this process, and then patterns and meanings are extracted for use as the basis for organizational decision-making. Data is prioritized over intuition, personal experiences, and opinions whenever data is available to inform a course of action since they are thought to be sources of inherent bias.
Business decisions are always subject to risk, but data-driven decisions reduce your vulnerability to risky decisions going wrong. Suppose you are planning a go-to-market strategy for a SaaS company. Instead of beginning from scratch and hoping that a new strategy will succeed, take a look at the previous product features you have launched. Was there anything that worked? Reproduce it. If something did not work, do not implement it.
Make smarter business decisions based on the data you have collected and do more of what worked. This model is also supported by research. There was an increase in profit of 8–10% and a reduction in overall costs of 10% for businesses using data.
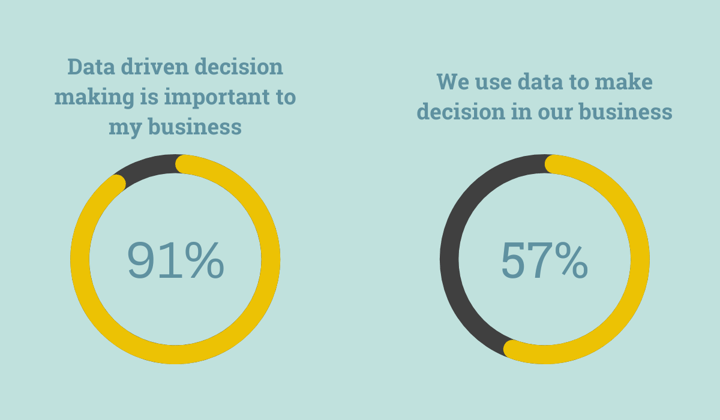
It is reported that 91% of companies believe that data-driven decision-making is essential for their business growth, however, only 57% of companies base their business decisions on data.
Using data-driven decision-making can help you increase profits, reduce costs, and gain a competitive edge!
6 steps to effectively make data-driven decisions
In order to make the most of data, you should be able to determine "who, what, where, when, and why." For you, your colleagues, and your company at large. However, it is important to keep in mind that visual analysis is not a linear process. The answer to one question may lead to another, which may require you to go back to a previous step or skip ahead to a subsequent step, which will ultimately lead to useful insights.
Step 1 - Identify business objectives
The first step in this process is to understand the executive and downstream goals of your organization. There may be a specific objective, such as increasing website traffic and sales numbers, or there may be an ambiguous objective, such as increasing brand awareness. Identifying key performance indicators (KPIs) and metrics that influence business decisions will assist you later in the process in choosing which data to analyze and what questions to ask so that your analysis supports the key business objectives. In the case of an advertising campaign that focuses on driving website traffic, a KPI may be tied to the number of contact forms collected so that sales can follow up with leads.
Step 2 - Survey teams for data sources
Achieving success requires input from all levels of the organization in order to understand short- and long-term objectives. You can use these inputs to inform the questions that people ask in their analysis and how you prioritize certified data sources.
Your analytics deployment and future state will be guided by valuable inputs from all aspects of the organization-including roles, responsibilities, architecture, processes, and success measurements.
Step 3 - Collect and prepare the data
Your business information may be dispersed across multiple disconnected sources, making it difficult to access quality, trusted data. As soon as you have a clear picture of the breadth of data sources across your organization, you can begin preparing the data.
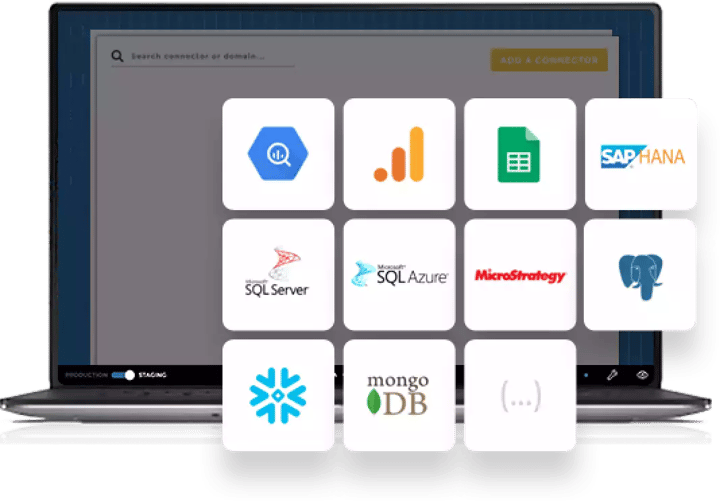
Preparation of high-impact and low-complexity data sources should be the first step. Prioritize data sources with the largest audiences in order to make an immediate impact. Create a dashboard based on these sources.
In order to give clients a complete view of their brand efforts, the marketing agency Verified Market Research centralized all their data using Toucan's 1-click interaction and 0-code data prep. This enabled the agency to create custom dashboards for more than 100 clients and provide them with a comprehensive view of their brand.
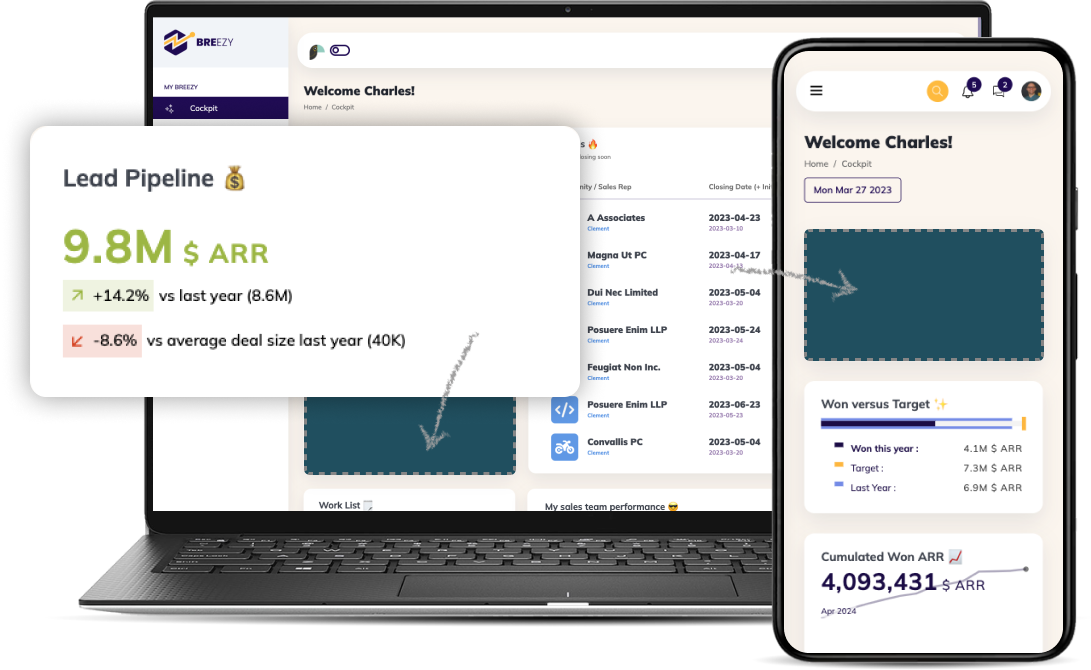
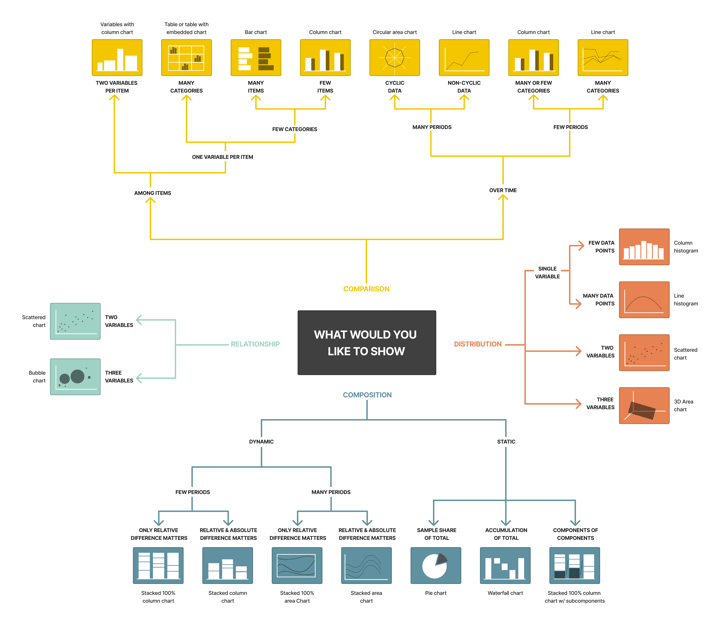
Step 4 - Data Visualization
A key component of data-driven decision-making is visualizing your data. By visually communicating your insights, you will have a greater chance of influencing senior leadership and other staff members.
Using visual elements such as charts, graphs, and maps, data visualization allows users to see and understand trends, outliers, and patterns in data. For displaying information effectively, there are many popular visualization types: a bar chart for comparison, a map for spatial data, a line chart for temporal data, a scatter plot for comparing two measures, etc.
With Toucan you take it one step further with data storytelling. Instead of simply representing the data, show the entire story behind it making it easy for non-technical business users to understand the analytics. Check out the difference between data storytelling and data visualization.
Step 5 - Develop actionable insights
In order to think critically about data, one must be able to identify insights and communicate them in a meaningful and engaging manner. With visual analytics, you can ask and answer questions about your data in an intuitive manner. Identify opportunities or risks that may affect success or problem-solving.
Often times non-technical business users are left out at this step when they are the ones making the decisions. This is why Toucan is filled with context at every step with a glossary, comments section, descriptions, tips and color-coded analytics.
In order to make decisions that have a significant impact on financial growth, Delloite adopted a modern analytics solution, Toucan. By combining customer data with line-of-business relationships (i.e. products, marketing, and service touch points), Delloite is able to gain an in-depth understanding of the customer's journey and start a new line of business for the accounting customers.
Step 6 - Share your actionable insights
After discovering an insight, you must act upon it or share it with others to collaborate. Sharing dashboards is one way to accomplish this. The use of informative text and interactive visualizations can help you influence your audience's decisions and help them take more informed actions every day.
Toucan makes sharing easy. With 1-click users can share analytics by email, as a pdf or via slack. Users can also annotate before sharing to ensure they highlight important points or point out discrepancies to further enhance collaboration and decision-making with data.
Benefits of data-driven decision-making
If you wish to lead by example and foster a data-driven culture in your organization, you must be adept at analytics-based decision-making.
Using data to make decisions will enable your business to remain fair, goal-oriented, and focused on continuous improvement.
Make confident decisions
In order to outlast their competitors, businesses must be confident in their ability to succeed. Business decision-makers who waiver from their choices may result in mistakes, high turnover among team members, and poor risk management.
You will feel more confident about your business decisions when you use data to make them, which will push you as well as your team forward. Positive team morale and improved performance can be attributed to confidence.
Guard against biases
By utilizing data to make decisions, business leaders will be able to avoid biases. Even if you are unaware of your biases, the way you make decisions can be influenced by internal biases or values.
Your decisions will be objective and fair if they are based on facts and numbers. Furthermore, it provides you with evidence to support your decisions when team members or stakeholders question your choices.
Find unresolved questions
Many questions cannot be answered without the use of data. Your data sets may also reveal questions you did not know you had. With the help of statistics, graphs, and charts, you can gain a better understanding of areas you cannot see without data.
By bringing those questions to the forefront, you can feel confident that your decisions were made based on all relevant information.
Set measurable goals
One of the easiest ways to set measurable goals for your team is to use data. By analyzing internal data on past performance, you can determine what needs to be improved and set granular goals. Without data, it would be difficult for your company to identify where it spends its money and where it would like to make savings. Measuring goals ultimately leads to data-driven decisions since once these goals are set, you will be able to determine how to reduce the overall budget or increase the number of customers.
Improve company processes
You can improve company processes without using data, but when you observe trends in team members' performance with numbers or analyze company spending patterns with graphs, the process improvements you make will go beyond observation alone.
Processes you can improve with data may include:
- Risk management based on financial data
- Cost estimation based on market pricing data
- Team member onboarding based on new hire performance data
- Customer service based on customer feedback data
If you aren't confident about the outcome, changing a company process can be challenging; however, if you have the facts in front of you, you can make confident decisions.
Making decisions based on data is a transformative process. Data becomes a critical enterprise asset when visual analytics is embraced by everyone within an organization. By implementing a modern business intelligence solution, data-driven decision-making becomes a company mission rather than an inconvenience. This leads to faster, more informed decisions. As a result, these decisions will boost the bottom line, increase creativity and commercial success, and enhance employee engagement and collaboration.