


How to Create an Annual Sales Report with 6 Examples
.png?width=88&height=88&name=portrait_agathe_face%20(1).png)
Agathe Huez
Publié le 26.12.22
Mis à jour le 13.01.26
6 min
Annual sales report, also known as an annual sales analysis report, is a document that summarizes a business’s sales activities. This report should include all the important sales KPIs such as sales volume, leads, new accounts, revenue and costs for a given period. It should also analyze every step of the sales funnel while providing actionable insights that indicate how your team can continue to modify its sales approach and growth initiatives.
Annual sales reports can also provide insights into sales methodology successes, predict future sales goals, analyze performance compared to previous periods, and gain a greater understanding of customer motivations.
How Do You Write a Sales Report? (5 Steps)
Everyone has the capability of stuffing numbers into a report and going on for hours in a long meeting. It is difficult to create a sales report that communicates accurate sales data and does not confuse your audience. That requires an understanding of how to create annual sales reports understandable by users of all technical levels in your organization.
Here are five steps to creating a successful sales report that will provide actionable insights to your audience.
1. Identify the Purpose
Your report serves the purpose of sharing sales metrics. However, it is impossible to include all the sales data. Instead, pay attention to the data that helps you or your organization to achieve specific objectives.
Consider why you are preparing a sales report in the first place. Do you want to measure the effectiveness of your promotional campaigns? Do you want to identify interesting sales trends for a sales forecast? Are you using your sales report to motivate your team to perform better? Or is it merely a snapshot of data that will be useful to the sales operations team?
You will be able to gather and analyze the right kind of data by understanding the purpose of your sales report. Additionally, it will assist you in determining the scope of your report.
2. Know Your Audience
Once you have determined why you are creating a sales report, the next step is to identify your target audience so that your report is focused on the information they value.
It would not be appropriate to send the same cold email to a CEO and a marketing director, would it? It is also not a good idea to send them the same annual sales report.
For example, a marketing manager is likely to be interested in details such as which marketing campaigns produced the most profitable sales.
However, the CEO and other decision-makers are more interested in the "big picture," such as the overall growth of the company, rather than the specifics of each campaign.
3. Gather Your Data
The next step is to gather sales data, filter the information, and analyze it. Make sure your data collection process is goal-oriented and hassle-free. If possible, use tools that integrate with your CRM or other sales software —this will make pulling the data a lot easier.
Outline the metrics you want to include in your report as well as the overall trends you think are important. There are several key performance indicators that should be included in a standard sales report, such as team performance, number of goods sold, net sales, profits, and customer acquisition costs.
Additionally, you may wish to include metrics related to sales growth, regional sales, new opportunities, team performance, etc.
It is necessary to clean up or filter the data in order to eliminate duplicate records and concentrate on specific areas in order to improve the accuracy of the data. As an example, if you would like to share sales metrics for North America, you would exclude numbers from overseas.
Defining the time period for your report is the next step. It is usually a good idea to compare two different time periods-current and previous-before making any final decisions. As an example, you might compare metrics from month to month or year to year.
4. Create Engaging Visuals to Highlight Important Sales Metrics
Do you recall sitting through a meeting where the presenter simply read slides full of text? Besides being boring, it is also more difficult to absorb information when presented in this manner.
Data presentation is just as important as the data itself. This is where data visualization can help. Consider using graphs and charts to convey the impact of important data rather than asking managers to go through spreadsheets full of numbers. These graphs would not just be basic representations but also provide valuable insight to the viewers.
As an example, a line graph may represent the increase or decrease in revenue over a period of time. Pie charts can be used to illustrate how much each product contributes to total sales. A bar graph can be used to compare the performance of employees.
Data Visualization helps make your sales report easy to understand and digest. In addition, it can provide valuable insight into trends and challenges in key sales metrics that may have an impact on sales performance over the next few months. Visuals can help you create a captivating report that keeps your audience interested. Use a tool like Toucan to create in-depth and easy-to-understand data visualizations for your reports.
5. Explain What the Sales Numbers Mean
The final step is perhaps the most crucial. It is important to keep in mind that presenting data itself is only half the battle. In order for your audience to be able to comprehend what you are saying, you must put words to your data.
Consider the example of your monthly report showing a decline in sales from the previous period for the first time in several months, and do not presume that your audience will understand the reason for this decline. Analyze the decline and suggest that it may be the result of a seasonal slowdown compounded by an economic downturn. Additionally, you should provide a written summary of the previous period's data in your report.
Throughout your written explanations, your figures should be justified by your explanations. In addition, they should outline the fixes that your team plans to implement. As an example, if your sales have been reduced by a competitor's limited-time discounts, explain how you will regain those customers. You can meaningfully present even the most concerning data if you determine an actionable, fixable root cause. Once you do act, sales could increase. This is where the value of the sales report lies.
What Types of Annual Sales Reports Are There?
Various types of annual sales reports exist, and no single document is appropriate for every organization. As a matter of fact, different teams within an organization may utilize different sales reports to display a variety of information.
Here are the most common types of annual sales reports and when to use them.
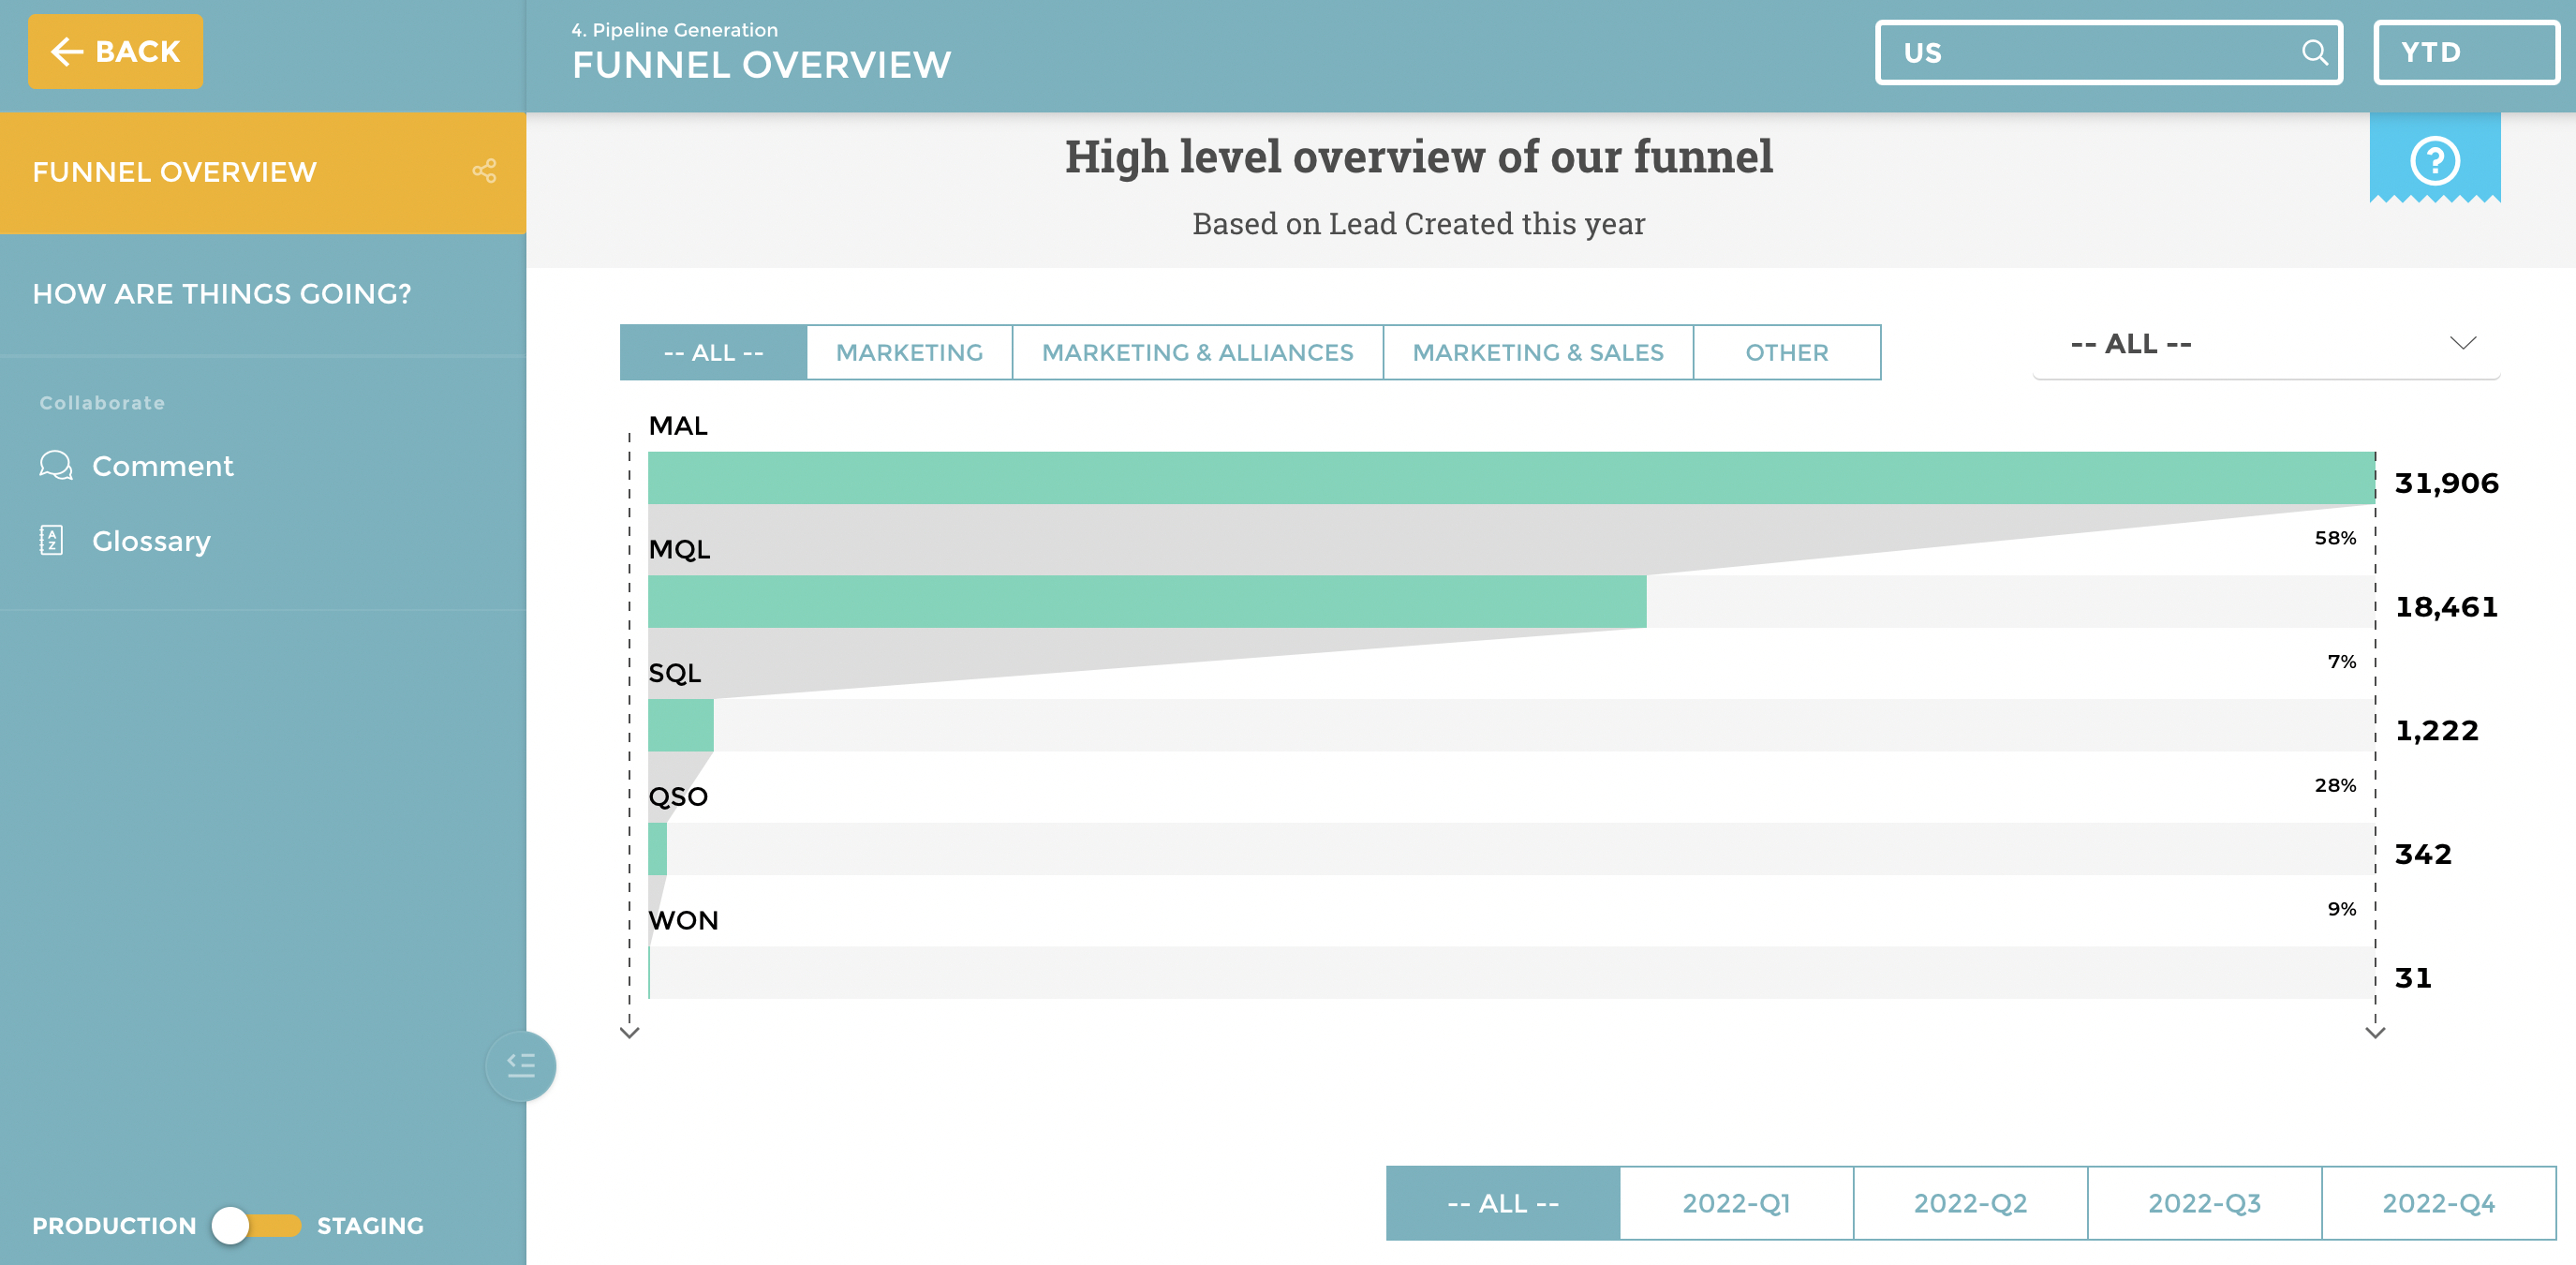
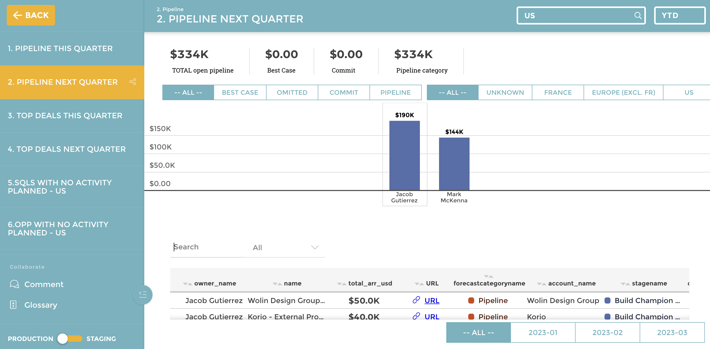
1. Sales Pipeline Report
Annual sales pipeline reports show the value of your sales pipeline and how many deals are in each stage. The report highlights how the company's overall revenue could be affected by how many deals will be lost and won.
All key stages of the deals are outlined in the pipeline report so that annual sales cycles are clear.
- Use this sales report to showcase success or challenges in your sales pipeline.
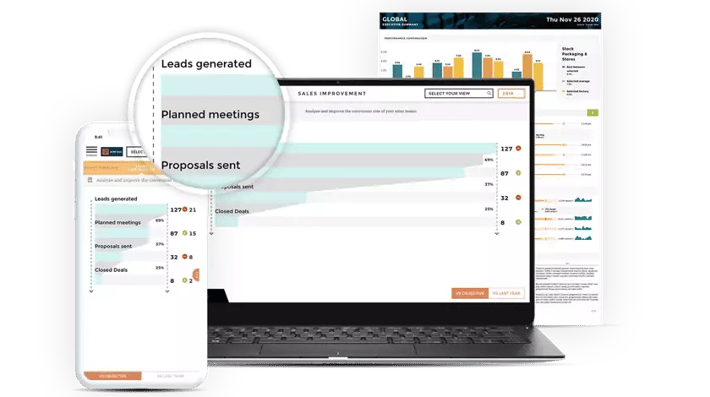
2. Conversion Rate Report
A conversion rate, or win rate, report shows how effectively your sales team is converting new leads into new customers.
In addition to providing insight into the strength of your overall sales strategy, this data highlights the performance of your sales reps and sales team as well.
The conversion rates of individual salespeople can provide insight into their overall strengths and weaknesses.
Reporting conversion rates at each stage of the sales process can help you identify areas for improvement if leads aren't becoming won deals and new customers.
- Use this sales report to highlight the difference between leads that close and ones that don't or to highlight the difference in performance between sales reps/teams/campaigns.
3. Customer Churn Report
Using the churn rate, you can see how frequently your customers stop doing business with your company or stop using your products.
The churn report will not only show you when customers leave but also why they did so.
A high churn rate could indicate that you are targeting the wrong prospects when it comes to sales.
- Use this sales report to track the number of customers to churn and traits they share, such as company size, sales rep, lead source, etc.
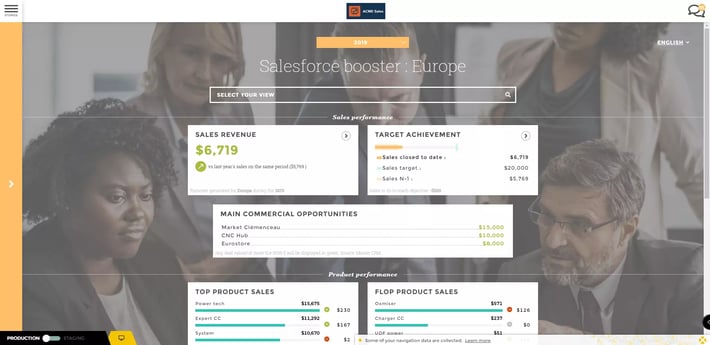
4. Sales Forecast Report
The sales forecast is a detailed report that estimates how much a company, a sales team, or a salesperson will sell each week, month, quarter, or year.
Forecasting sales can help you identify potential problems early when they are still able to be avoided or corrected.
The Pipeline View in Close allows you to forecast future sales easily:
- Use this sales report to predict future sales by rep, team, location, or type of lead.
5. Deals Won and Deals Lost
You can measure the success of specific sales efforts by tracking the deals you win and lose.
In addition to revealing which products are most popular, this report will reveal which products are least popular.
To maximize your chances of winning more business, you can identify trends relating to the best-performing product offerings by using the right data.
Sales managers can also use won and lost reports to determine how each of their sales reps and teams is doing.
- Use this sales report to track trends in won and lost deals by product type, company details, sales teams, or specific reps.
6. Sales Calls Report
Measure the number of sales phone calls made by your sales representatives to their prospects in order to determine their effectiveness.
By doing this, you will be able to determine if there are any gaps in close rates or discrepancies between the number of phone calls and the number of closed deals.
Additionally, you can use the call reports to isolate specific metrics and segment data about individual prospects.
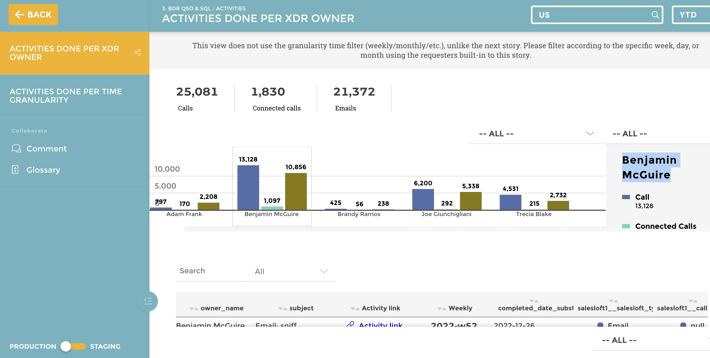
Use this sales report to set benchmarks for new hires, gather data about valuable leads, and optimize your sales process.
.png?width=112&height=112&name=portrait_agathe_face%20(1).png)
