PostgreSQL is the second most popular open-source database in the world, and for good reason. This database is versatile, extensible, and has a large community of users, making it a reliable choice for companies seeking a database that can grow as they do.
On the other hand, selecting the right PostgreSQL reporting tool is not so straightforward. As a result of the large community that has developed around PostgreSQL, you have a wide variety of options for making sense of your data and helping visualize it. Here is how to select the most appropriate one for your company.
Factors to Consider Before Selecting a PostgreSQL Reporting Tool
Data warehousing systems can be made more effective or less effective depending on the reporting tool that you choose, such as PostgreSQL. Prior to selecting one of the PostgreSQL reporting tools available on the market, you should consider the following factors:
- A platform's learning curve or the amount of time required to learn and use it effectively.
- Analytical and data transformation functionality provided by the platform.
- The tools you need can be either real-time or batch-based, depending on your business use case.
- The type of customer service your organization requires, such as community or individual support.
- You will need to choose between on-premises or cloud-based reporting tools for your organization.
5 PostgreSQL reporting tools
Toucan

- Learning curve: 0-code and intuitive
- Analytics and data transformation: Robust
- Customer service: Excellent
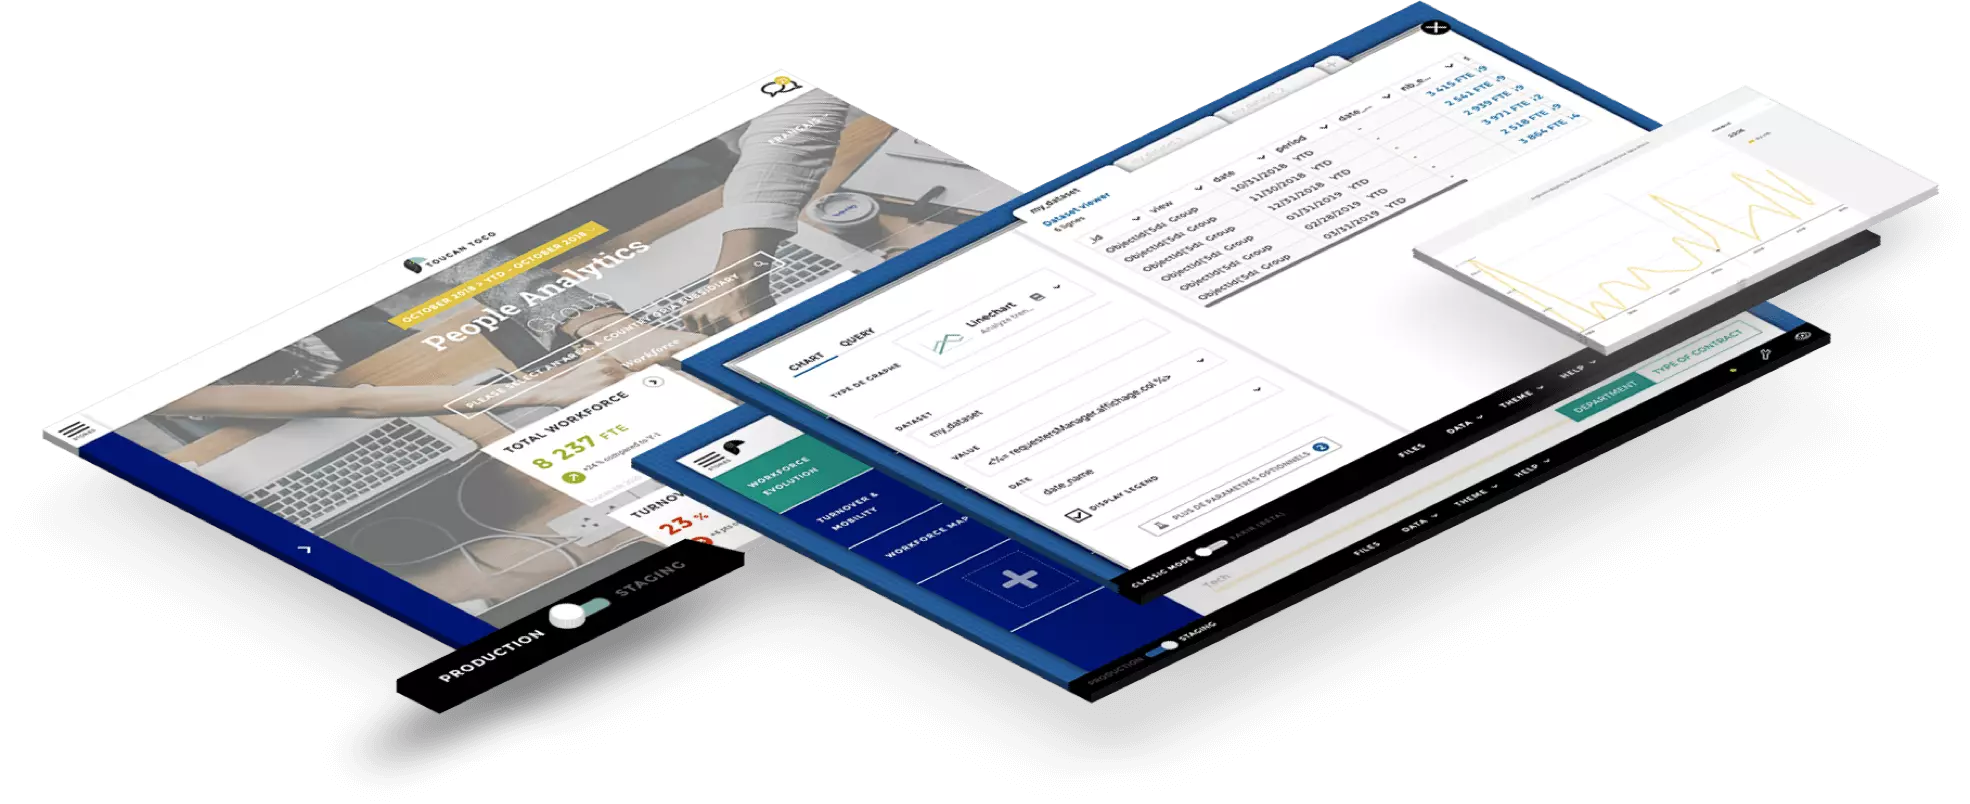
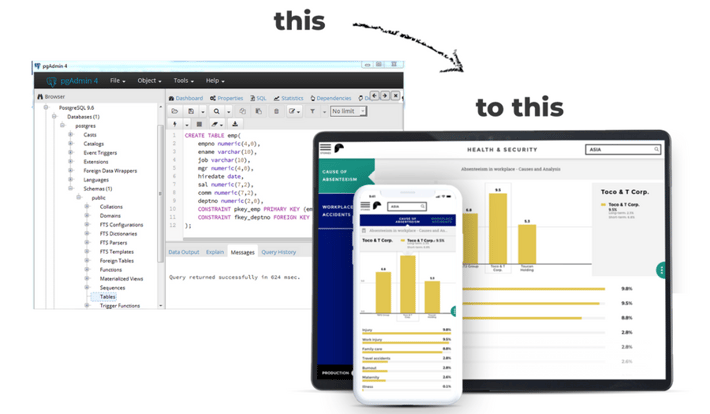
Toucan is a powerful analytics tool and the highest-rated analytics tool on G2. Toucan is the only tool built with the end user in mind and thus offers a 0-code interface making it easy for users of all technical leaves to transform data, build visualizations and gain actionable insists. The connection to PostgreSQL is made even easier with a one-click integration which can be completed within a minutes.
Toucan is a web-based application and boasts the build once deploy anywhere functionality. With this, once you have built a visualization, it will adapt to be viewed on any device from smartphones to televisions. Toucan boasts the best customer service for any analytics solution on G2. This ensures you always have help when needed and can deploy your analytics within weeks. Toucan has a heavy emphasis on providing context with functionality like a glossary section, in-application comments, annotate and share and color-coded metrics to name a few. Toucan is built for all organizations from small companies to enterprises as it was built to scale. Overall Toucan is one of the best analytics solutions for PostgreSQL in the market.
"We have been using Toucan Toco for quite some time and since we started using it to this day, we have not had any kind of negative experience about it, we only have positive things to say." - Brent C. on G2
Tableau
- Learning curve: Steep
- Analytics and data transformation: Good, most features behind a paywall
- Customer service: Poor
Tableau is a powerful reporting tool, available as part of the complete suite for managing all your data processing needs. Using its automatic refresh functionality, you can create informative business dashboards and reports that update in real-time. In addition, the creator license includes a data transformation module known as Tableau Prep.
On-premise and cloud-based versions of Tableau are available. For creating complex and interactive visualizations, you can either install Tableau Server/Online on your computer or use its cloud service. Since Tableau has a high learning curve, users need to devote a considerable amount of time to learning the platform in order to maximize its potential. Additionally, it does not offers strong customer support that will assist you in resolving any issues that may arise. This combined with the high level of technicality needed leads to delays in getting your analytics up and running.
"Not easy to learn, costly software, Help, and support are not that Good." - Saju S. on G2
Looker
- Learning curve: Steep
- Analytics and data transformation: Simple
- Customer service: Poor
Looker is one of the most popularly used reporting tools available in the market. You can create compelling visuals that match your business use cases with a focus on visualization and robust customization features. Additionally, it enables users to collaborate on business reports and share them easily.
Looker houses its own coding language in LookML. LookML adds complexity and a steep learning curve in generating SQL-based business reports and visualizations. Though the language is similar to SQL it is just different enough to need specialized training, Looker is primarily available as a web-browser-based offering. Looker only offers chat-based support, which means no matter how complex your question is, you'll have to explain it through text or find the answer online.
"I need a tab for transactions, another folder just for account search, another folder just for waller details. . .It's too many" - Moriessa J. on G2
Metabase

- Learning curve: Difficult as the platform is unintuitive
- Analytics and data transformation: Basic
- Customer service: Poor
Metabase is an open-source business intelligence tool for performing exploratory data analysis. Metabase enables you to query databases in real-time to retrieve crucial data, allowing you to receive answers to all your questions within minutes of installing it. In addition, it provides granular control over authentication mechanisms at the enterprise level.
Metabase is available as a SaaS offering both on-premises and in the cloud. If users wish to obtain some advanced functionalities for their business purposes, they can subscribe to the enterprise plan. The biggest drawback of Metabase is that it is not intuitive to use. Every function needs multiple clicks and something as simple as downloading a csv file is difficult for non-technical users. The limit of one query per table is extremely limiting and referencing tables has to be done in a separate iteration. Being a free software Metabase does not fare well on the customer support side leaving your team stranded if any difficulties arise.
Looker Studio

- Learning curve: Easy
- Analytics and data transformation: Clunky
- Customer service: Poor
Looker Studio, formerly known as Google Data Studio, is a fully-managed cloud-based reporting tool made available to users by Google. There is a user-friendly interface with a minimal learning curve and robust integration support for PostgreSQL and almost 200+ other connectors, enabling you to easily integrate data and create compelling visualizations.
Due to its web-based architecture, it doesn't provide any on-premise or desktop application-based functionality. The calculated fields and metrics in Google Data Studio enable you to perform an in-depth analysis of your data. It also supports refreshing your data source at scheduled intervals but does not support real-time or auto-refreshing dashboards. The biggest drawback is customer support. Unlike Looker, Looker Studio doesn’t even offer chat-based support. The only way to resolve issues is by combing through the online forum. Since it is a free platform the visualizations offered are clunky and do not offer actionable insights to users. It is a good tool for lean startups or single-person businesses but not advised beyond that point.
Choosing the ideal reporting tool that perfectly meets your business requirements can be a challenging task, especially when there’s a large variety of tools available in the market. Compare how the tool's functionalities stack up to your data needs and if your organization is prepared to face the challenges offered by the tool. There are the best tools for each situation. If you need a free tool for a startup you should go with Looker Studio. If you are looking for a tool made for data experts Tableau is the best bet. But if the bottom line is increased analytics adoption and data-based decision-making to increase revenue, Toucan is the tool for you.
"It's very difficult to make calculations if they are easy or if they are complicated on your data" - Looker Studio user on G2