A customer-facing dashboard provides a direct indication of the health of your business as it relates to your product and your customers. In order to grow your business, it is crucial to have an understanding of your customer's revenue activity.
It has become increasingly difficult to maintain a positive customer relationship in today's hyper-competitive SaaS industry.
Besides hiring more customer success managers and optimizing the customer journey, you also require a customer-facing dashboard that enables you to gain revenue insights into every aspect of the customer experience. It is important to highlight the positive aspects of customer success (new customer ARR, upsells) as well as the negative aspects (downgrades and churn).
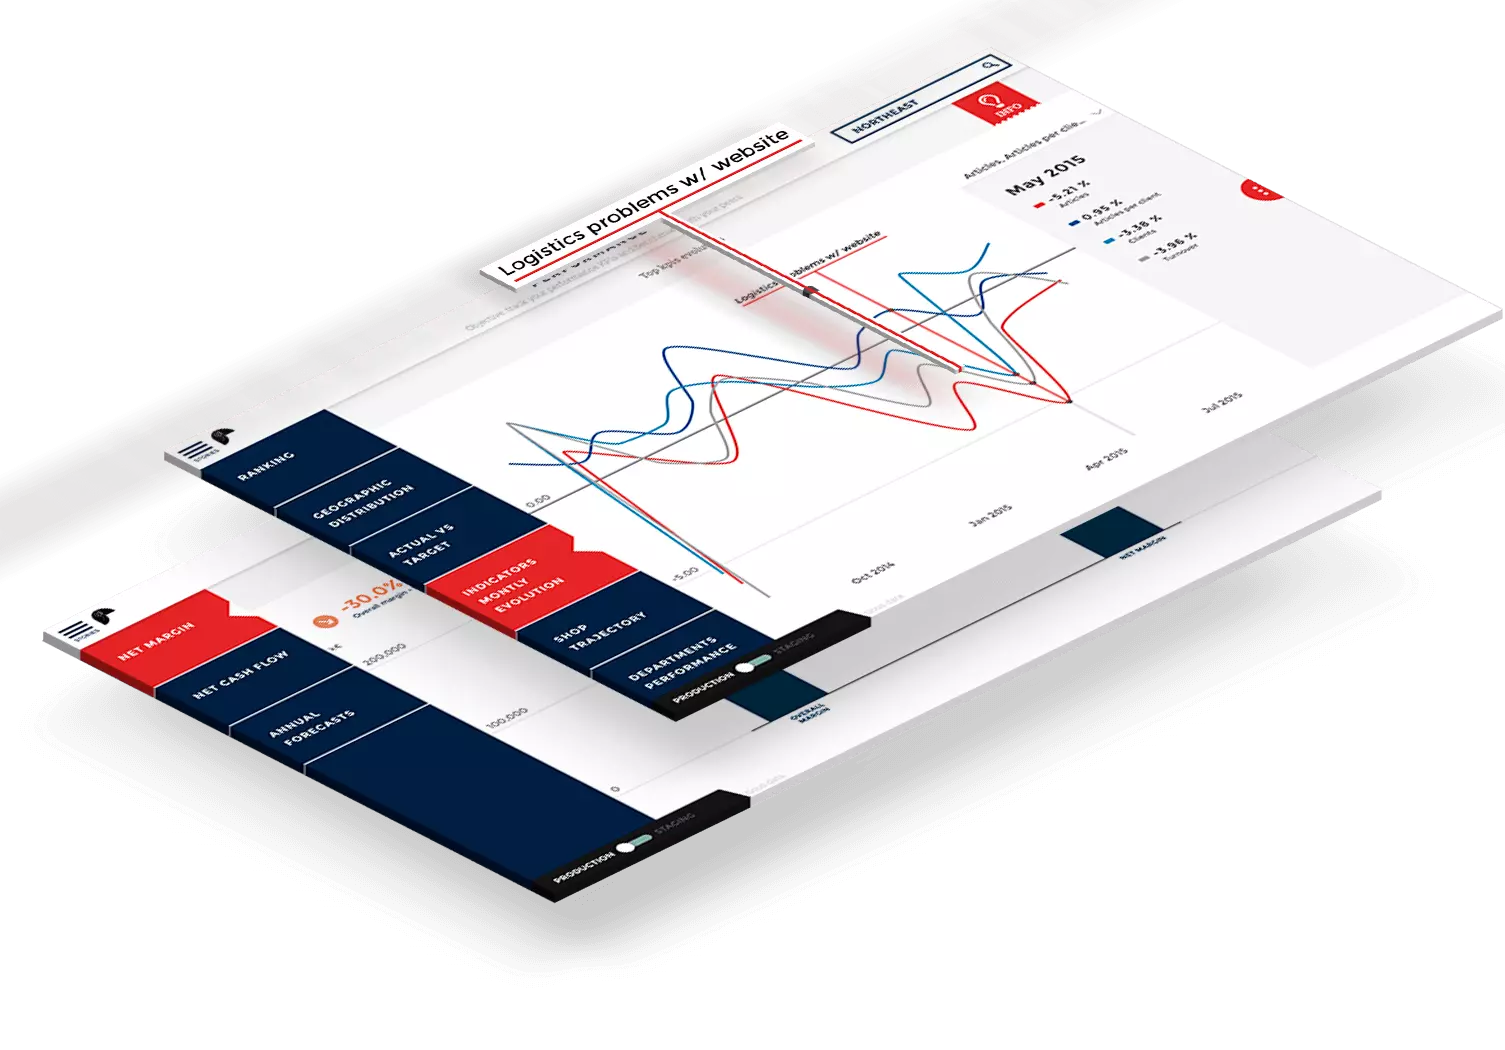
A customer-facing dashboard can be created by combining data from multiple sources (CRM data from Salesforce, customer data from Zendesk) using a data analytics tool like Toucan.
Customer-facing Dashboard Design Best Practices
When you follow industry best practices, client dashboards can become the eighth-world wonder.
1. Keep It Simple
Keep it simple when setting up your customer-facing dashboard. This is the single most important aspect of designing a customer-facing dashboard. You should limit your dashboard to only the most essential metrics, despite the temptation to display every critical metric.
Ideally, you should implement the 5-second snapshot rule. You should be able to determine where your attention is needed within five seconds or less by viewing your customer-facing dashboard. This you are able to go one step further than understanding your data. You need to be able to actionable insights from it, allowing you to see what corrective or precautionary course is needed next.
With a dashboard that features only the most important and relevant gauges, you will quickly be able to determine where you stand. It is important to note, however, that keeping it simple doesn't mean you will need less information.
2. Keep the Viewer in Mind
You should consider who will be using your customer-facing dashboard most often when choosing which KPIs to include. Who is the target audience for this dashboard viewer? How will they measure their success? Are there any metrics you won't need as often?
Determine which metrics the users of your customer-facing dashboard access most frequently in their daily work and include these KPIs on your main dashboard for that specific position.
For a dashboard, we recommend including a maximum of 7 KPIs. Why seven specifically? A study found that the average capacity of the brain's working memory was seven objects. By only providing 7 major KPIs you can be assured that your dashboard users will understand and retain the information being presented. Do not overwhelm the customer-facing dashboard’s users with a page full of numbers. The focus should be on keeping relevant information together and limiting the number of KPIs.
3. Choose the Right Visualization
Choosing the right visualization to represent the right data is the key to gaining actionable insights from your customer-facing dashboard. It is important to keep in mind that certain visualizations lend themselves well to certain types of data. There is a wide range of visualizations to choose from so here is a concise graphic to help you choose the right one.
Displaying data in the wrong way can misrepresent it to the viewer. The purpose of each specific metric should be considered. As an example, a pie chart would not be a useful tool for comparing daily support ticket metrics among dozens of support agents since it would be jumbled and difficult to understand.
Choosing the right visualization is vital for interpreting and analyzing data, but if you decide to change it later, you can update your selection easily in the Toucan app.
4. Optimize the time and resources needed
In order to maintain an optimal dashboard, it is necessary to monitor response and loading times continuously. It is important to keep track of the load time of the dashboard (over time and not only during the development stage), regardless of any additional features that may be added. When a dashboard's loading time is long, users will find another SaaS implementation build with more useful features. For a dashboard's performance to be maximized, it is necessary to analyze and allocate the time needed for ongoing maintenance.
For optimal management and implementation costs, it is important to analyze how much time and resources will be required for creating a dashboard. Prioritize the maintenance of the SaaS dashboard before adding as much information as possible in order to avoid slowing down any processes and mitigate any potential impact on its performance. Over time, dashboards must be maintained in order to remain manageable as the system grows. The success of a dashboard depends on understanding the need for a regular maintenance process and allocating time for maintenance in every development cycle.
5. Review Regularly
Ensure that you review and revise your customer-facing dashboards on a regular basis in order to keep them relevant. Perhaps once every few months or so, or in accordance with your company's planning cycle (e.g., if you plan quarterly, make sure you're still tracking the right things since the dashboards are likely to influence your initiatives).
Since customer-facing dashboards monitor data that is everchanging, discussing how to revise dashboards can be a bit abstract. In order to prepare you for the revision process, here are some questions you should ask when revising them. All of these questions do not require solid answers; they are simply intended to prompt your thinking.
- Do these charts and tables still show you how you’re making progress in the direction you want to be going?
- Are the KPIs still key?
- Does the dashboard uncover the risks you’re facing?
- Who has started at the org since you last updated this dashboard? Do they know about it?
- Do all relevant individuals have access to the dashboard?
- What’s changed since you last updated this dashboard? Any new risks or opportunities?
- How has customer behavior changed since you last revised the dashboard?
- Would it be possible to make the dashboard more responsive?
- What is the best way to visualize the data using these charts?
3 Things to Consider When Building Customer-Facing Dashboards
1. Customization
Customization is essential in customer-facing dashboards as users will want to have a view best suited to their needs. Being able to edit data on the go, create custom filters, include HKPIs, write tips and color code all the metrics are key features that all dashboard builders should invest in. If you do not have the time to build them in-house, or your current software doesn’t offer the capabilities it is time to move to Toucan.
2. Interactive Elements
Interactions must go beyond just moving visualizations and emphasizing KPIs. Your customer-facing dashboards should come inbuilt with comments sections so that users can interact on the same platform, leaving insights, methodologies, or explanations. Further having an annotate and share feature that allows users to note specific details and share them via pdf, email or slack allows users to communicate more effectively.
3. Integrations
Since customer-facing dashboards are centralization of data from multiple sources, it is key to have inbuilt integrations for a multitude of platforms. At Toucan we have one-click integrations to over 100+ data sources to make the integration process as seamless as possible.
Creating effective customer-facing dashboards doesn’t have to be as time-consuming as it sounds. With the right tools, like Toucan, you get powerful reports out to your clients whenever you want.